本网页使用 OpenAI Codex(AI编程助手)辅助撰写、解释、翻译与编排,并生成绘图和动画代码。具体底层模型版本未统一记录,因此不标注未经确认的型号。OpenAI Codex assisted with writing, explanations, translation, layout and code for plots and animations. Exact model versions were not consistently recorded.
Python、Matplotlib、Cartopy、Manim是计算、绘图或动画工具,不是AI模型。标注“AI辅助”表示相关文字或代码经过AI处理,不表示观测数据由AI生成。Python, Matplotlib, Cartopy and Manim are computational or rendering tools, not AI models. AI assistance refers to text or code, not the fabrication of observations.
作者提供的课堂经历、教材图片、文档及Excel内容与AI整理部分分别说明。外部资料和用户提供文件的原始制作工具未核实;本说明不把它们认定为本助手原创。Reported learning experiences and supplied figures, documents and Excel content are distinguished from AI-assisted work. Original tools used for external or supplied materials have not been verified.
核心内容Core Concepts
AI辅助整理:OpenAI Codex|本节的解释、中文改写、英文翻译或网页编排含AI生成内容;引用资料及用户原始材料不因此变为AI生成。AI assistance: OpenAI Codex. Explanations, rewriting, English translation or layout include AI-generated work; cited and supplied source materials retain their own provenance.
从六个关键概念进入物理海洋学,点击卡片查看解释。Explore six key concepts. Select a card to read the explanation.
AI辅助整理:OpenAI Codex|本节的解释、中文改写、英文翻译或网页编排含AI生成内容;引用资料及用户原始材料不因此变为AI生成。AI assistance: OpenAI Codex. Explanations, rewriting, English translation or layout include AI-generated work; cited and supplied source materials retain their own provenance.
按用途选择观测数据、文献与可视化资源。Choose observations, literature and visualization resources by purpose.
AI辅助整理:OpenAI Codex|本节的解释、中文改写、英文翻译或网页编排含AI生成内容;引用资料及用户原始材料不因此变为AI生成。AI assistance: OpenAI Codex. Explanations, rewriting, English translation or layout include AI-generated work; cited and supplied source materials retain their own provenance.
AI辅助整理:OpenAI Codex|本节的解释、中文改写、英文翻译或网页编排含AI生成内容;引用资料及用户原始材料不因此变为AI生成。AI assistance: OpenAI Codex. Explanations, rewriting, English translation or layout include AI-generated work; cited and supplied source materials retain their own provenance.
我把这些知识串成一条线:先描述海水是什么状态,再问它为什么运动、怎样调整,最后用观测检验解释。公式不是孤立的记忆点,而是回答这些问题的工具。I connect the topics by first describing the ocean state, then asking what drives motion and adjustment, and finally checking explanations against observations. Equations serve these questions rather than standing alone.
难点有两个:我们站在自转的地球上看海流,而且海水是连续介质,速度、压力和密度在空间中不断变化。因此既要看受力,也要看水与周围水体之间的交换。Two challenges are that our reference frame rotates with Earth and seawater is a continuum with spatially varying velocity, pressure and density. Both forces and exchanges with surrounding water matter.
温度、盐度和压力共同影响密度;密度随深度的变化形成层结。热收支告诉我海洋怎样获得或失去热量,混合层告诉我这些能量分摊在多厚的水里。Temperature, salinity and pressure affect density; its vertical structure controls stratification. Heat budgets describe energy exchange and mixed-layer depth sets the volume over which heating is distributed.
2. 先抓住地转平衡,再加入摩擦2. Start with geostrophy, then include friction
大尺度缓慢变化的海流可以先用压强梯度力与科氏力平衡理解。近海面加入风应力和湍流应力后,就需要考虑艾克曼流:表层流向与整层净输运不是一回事,辐合或辐散还会引起下沉或上升。Large-scale slowly varying currents can be understood through pressure-gradient–Coriolis balance. Surface wind and turbulent stresses introduce Ekman flow; surface velocity differs from integrated transport, and convergence or divergence drives vertical motion.
3. 地转平衡加上层结:读懂湾流剖面3. Combine geostrophy and stratification
我的理解重点是把密度、动力高度和速度连起来。课堂讨论帮助我判断湾流方向:先确定剖面朝向,再看哪一侧动力高度高,最后用北半球高值在流向右侧的规则检查。河流羽状流也有密度差与旋转作用,但近河口还可能明显受惯性、潮汐和混合影响。I connect density, dynamic height and velocity. Classroom discussion helped me interpret the Gulf Stream section: establish orientation, compare dynamic heights, then apply the Northern Hemisphere high-on-the-right rule. River plumes also involve density contrasts and rotation, with inertia, tides and mixing important near the mouth.
4. 从旋转到位涡:不能只看流得快不快4. From rotation to potential vorticity
相对涡度看的是局地旋转,不是平移速度;直线流也能因剪切而有涡度。再加入地球自转和水柱厚度,在单层浅水模型中得到q=(f+ζ)/H。理想条件下的位涡守恒把水柱拉伸、压缩和南北移动联系起来。Relative vorticity measures local rotation, including rotation due to shear in straight flow. In a shallow-water layer, q=(f+ζ)/H connects relative rotation, Earth’s rotation and thickness. Under ideal conservation conditions, stretching, compression and meridional displacement are linked.
5. 海洋怎样传递调整信号?5. How does the ocean transmit adjustment signals?
我把波看成扰动传播的方式,不把波传播等同于水团一路迁移。罗斯贝波重点看背景位涡梯度;开尔文波重点看重力恢复及海岸或赤道约束。大陆架波还受陆架地形控制。它们不能简单归成同一种沿岸波,罗斯贝波也可以在大洋内部传播。Waves transmit disturbances; their propagation is not identical to parcel travel. Rossby waves rely on background PV gradients, Kelvin waves on gravity and coastal or equatorial trapping, and shelf waves on shelf topography. Rossby waves need not be coastally trapped.
海洋波动:动画与完整对照表Ocean Waves: Animation and Comparison Workbook
先观看开尔文波与罗斯贝波动画,再用完整表格比较不同海洋波动。动画72秒,中英双语文字,无配音。Watch the 72-second bilingual animation, then explore the full wave comparison. No narration.
动画制作:OpenAI Codex生成及修改Python脚本,Manim Community渲染。中英双语屏幕文字由Codex辅助撰写;无配音,内容为理想化教学示意。Animation: Python scripts generated and revised with OpenAI Codex, rendered with Manim Community. Bilingual text was AI-assisted. Idealized teaching illustration, without narration.
以下保留所提供表格的原文与英文波名。表格较宽,可左右滚动;原有双语罗斯贝波与开尔文波专题对比仍保留在下方。The table preserves the supplied text and English wave names. Scroll horizontally; the bilingual Rossby–Kelvin comparison remains below.
完整对照表来源:用户提供的Excel;OpenAI Codex辅助提取并转换为网页。文件原始制作工具未核实。其余波动比较文字由Codex辅助整理。Full table supplied as Excel by the user and converted to HTML with OpenAI Codex. Original workbook creation tools are unverified. Other wave-comparison text was AI-assisted.
罗斯贝波与开尔文波对比Rossby and Kelvin Waves Compared
我的记忆线索:罗斯贝波看“位涡梯度”,开尔文波看“重力恢复+边界或赤道约束”。My memory aid: Rossby waves—PV gradients; Kelvin waves—gravity plus coastal or equatorial trapping.
理想理论与常见海洋应用 / Ideal theory and common ocean applications
水团位移与背景位涡梯度共同产生恢复作用。Displacements across background PV gradients provide the restoring mechanism.
沿传播方向由重力恢复,横向近似地转平衡。Gravity restores along-wave disturbances; cross-wave flow is geostrophically balanced.
关键条件Requirements
位涡梯度可来自β效应、地形或背景流。PV gradients from beta, topography or background flow.
海岸边界,或赤道附近f变号所产生的约束。A coastal boundary or equatorial trapping as f changes sign.
出现位置Location
大洋内部、赤道区域及受地形影响的区域。Ocean interiors, equatorial regions and topographic settings.
海岸或赤道附近。Along coasts or near the equator.
传播方向Propagation
经典无背景流β平面上相位向西;群速度不一定向西。Westward phase propagation on a classical beta plane without mean flow; group velocity need not be westward.
沿岸:北半球海岸在传播方向右侧,南半球在左侧;赤道:向东。Coast on the right in the Northern Hemisphere, left in the Southern; equatorial propagation is eastward.
速度特点Speed
依赖波长、纬度与垂向模态;同类大尺度内模态比较时通常较慢。Depends on wavelength, latitude and vertical mode; often slower for comparable large-scale internal modes.
浅水外模态c=√(gH);内模态应使用相应模态波速。External shallow-water speed c=√(gH); internal modes require their own modal speed.
频散Dispersion
通常频散;理想长波极限可近似无频散。Generally dispersive; approximately nondispersive in an ideal long-wave limit.
理想线性浅水模型中,同一模态无频散。Nondispersive within a single mode in ideal linear shallow-water theory.
空间结构Structure
不必依附海岸,可在海盆内分布。Can occupy basin interiors without a coastal boundary.
离开海岸或赤道振幅衰减;理想沿岸为指数、赤道为高斯型。Amplitude decays away from the coast or equator: exponential coastal and Gaussian equatorial profiles in ideal models.
时间尺度Time scales
可从数周至数年,跨海盆调整可能更久;不是固定范围。Weeks to years or longer for basin adjustment; not a defining fixed range.
随距离和模态变化;海盆内模态传播常为数天至数月,沿岸也可更短。Depends on distance and mode; basin internal-mode travel often spans days to months, with shorter coastal cases.
ENSO作用Role in ENSO
向西传递调整信号,并可能在西边界反射为开尔文波。Transmits westward adjustment signals and may reflect into Kelvin waves at the western boundary.
向东传递海面高度与温跃层扰动;可有上升型和下沉型。Transmits sea-level and thermocline anomalies eastward; both upwelling and downwelling signals occur.
直观理解Intuition
水团跨越位涡背景变化时,运动发生调整。Motion adjusts when parcels move across a PV gradient.
海面或界面起伏沿海岸、赤道这条通道传播。Surface or interface disturbances travel along a coastal or equatorial waveguide.
读表时先明确模型:相位方向不等于能量方向,波传播也不等于水团净输运;背景流、地形和层结会改变实际表现。Check the model assumptions: phase direction differs from energy propagation and parcel transport; mean flow, topography and stratification modify real behavior.
同学和老师的讲解帮助我把Sverdrup平衡理解为:风应力旋度与内区南北输运相联系。副热带内区输运需要回流闭合;西边界强化解释湾流、黑潮为何集中,但还需要边界层动力学。加州外海的Davidson流可作为季节性沿岸流例子,不能直接当作无边界内区Sverdrup关系的简单套用。Classmates and the teacher helped me connect wind-stress curl and interior meridional transport. Interior transport needs a return flow, and western intensification involves boundary-layer dynamics. The Davidson Current is a seasonal coastal-current example, not a direct application of the unbounded interior Sverdrup relation.
7. 最后把这些线索放进ENSO7. Bring the ideas together in ENSO
ENSO把风、温跃层、海温和大气反馈联系起来。赤道开尔文波可以向东传递温跃层变化,罗斯贝波向西传递调整信号;边界反射是可能的联系之一,而不是每次事件都由同一条反射链触发。学习时可以结合TAO时间—深度温度图、海面高度和海温指数。ENSO couples wind, thermocline depth, sea-surface temperature and atmospheric feedbacks. Equatorial Kelvin and Rossby waves transmit eastward and westward adjustment signals. Boundary reflections can contribute without being a universal trigger. TAO time–depth temperatures, sea level and SST indices provide complementary evidence.
8. 用数据检查理解,再谈预测8. Check explanations with data before prediction
我在课堂上学会了使用智能体解决问题。放到这个体系里,工具可以帮助整理概念和代码,统计、频谱和EOF则帮助分析观测;结果仍要检查单位、采样和适用条件。对过程的理解可以支持预测与环境管理,但一张概念图本身不是预测模型。I learned in class to use an agent to solve problems. Tools help organize concepts and code, while statistics, spectra and EOFs analyze observations. Units, sampling and assumptions still need checking. Process understanding can support prediction and management, but a concept map is not a forecast model.
按《Descriptive Physical Oceanography: An Introduction》第6版前八章整理为8次学习记录。三段解惑经历依据本人补充整理,分别归入工具学习与环流动力学;编号用于组织内容,不代表已核对的授课日期。Eight learning entries follow Chapters 1–8 of the sixth edition. Three reported learning experiences are grouped under tools and circulation dynamics; entry numbers do not specify verified class dates.
第1次课 · 描述性物理海洋学导论Lesson 1 · Introduction to Descriptive Physical Oceanography
AI辅助整理:OpenAI Codex|本节的解释、中文改写、英文翻译或网页编排含AI生成内容;引用资料及用户原始材料不因此变为AI生成。AI assistance: OpenAI Codex. Explanations, rewriting, English translation or layout include AI-generated work; cited and supplied source materials retain their own provenance.
教材对应:第1章Textbook: Chapter 1
学习要点 · 用通俗的话回顾Learning recap in plain language
理解一个海洋现象,先问它发生在多大的空间、持续多久,再决定用什么观测描述它。图上的变化需要放回时间和空间尺度里理解。To describe an ocean phenomenon, first identify its spatial and temporal scales and choose observations accordingly.
AI辅助整理:OpenAI Codex|本节的解释、中文改写、英文翻译或网页编排含AI生成内容;引用资料及用户原始材料不因此变为AI生成。AI assistance: OpenAI Codex. Explanations, rewriting, English translation or layout include AI-generated work; cited and supplied source materials retain their own provenance.
教材对应:第2章Textbook: Chapter 2
学习要点 · 用通俗的话回顾Learning recap in plain language
海盆不是一个平底水箱。陆架、海沟和海峡会限制水的运动,读海流图时也需要看地形;狭窄通道可能控制不同海盆之间的交换。Basins are not flat tanks. Shelves, trenches and straits constrain flow, and narrow passages can control exchanges.
第3次课 · 海水的物理性质Lesson 3 · Physical Properties of Seawater
AI辅助整理:OpenAI Codex|本节的解释、中文改写、英文翻译或网页编排含AI生成内容;引用资料及用户原始材料不因此变为AI生成。AI assistance: OpenAI Codex. Explanations, rewriting, English translation or layout include AI-generated work; cited and supplied source materials retain their own provenance.
教材对应:第3章Textbook: Chapter 3
学习要点 · 用通俗的话回顾Learning recap in plain language
温度、盐度和压力共同影响海水密度,因此不能只凭“冷水更重”判断不同水团。比较不同深度的水时,还需要注意压力造成的变化。Temperature, salinity and pressure jointly influence density; temperature alone cannot rank water masses. Pressure matters when comparing depths.
第4次课 · 海水特征的典型分布Lesson 4 · Typical Distributions of Water Characteristics
AI辅助整理:OpenAI Codex|本节的解释、中文改写、英文翻译或网页编排含AI生成内容;引用资料及用户原始材料不因此变为AI生成。AI assistance: OpenAI Codex. Explanations, rewriting, English translation or layout include AI-generated work; cited and supplied source materials retain their own provenance.
教材对应:第4章Textbook: Chapter 4
学习要点 · 用通俗的话回顾Learning recap in plain language
剖面图把海洋的垂向结构展开。混合层、温跃层和深层水不只是几个名词,而是温盐随深度变化呈现的不同结构;不同海区也不能套用同一条剖面。Profiles reveal mixed layers, thermoclines and deeper waters through vertical property changes; one profile cannot represent every region.
第5次课 · 质量、盐和热收支及风强迫Lesson 5 · Mass, Salt, and Heat Budgets and Wind Forcing
AI辅助整理:OpenAI Codex|本节的解释、中文改写、英文翻译或网页编排含AI生成内容;引用资料及用户原始材料不因此变为AI生成。AI assistance: OpenAI Codex. Explanations, rewriting, English translation or layout include AI-generated work; cited and supplied source materials retain their own provenance.
教材对应:第5章Textbook: Chapter 5
学习要点 · 用通俗的话回顾Learning recap in plain language
判断升温不能只看太阳辐射,而要把热量的收入和支出放在一起。还要区分热量与动量:热通量影响海温和层结,风应力直接传递动量。Warming depends on the heat budget, not solar input alone. Heat flux changes temperature and stratification; wind stress transfers momentum.
第6次课 · 数据分析概念与观测方法Lesson 6 · Data Analysis Concepts and Observational Methods
AI辅助整理:OpenAI Codex|本节的解释、中文改写、英文翻译或网页编排含AI生成内容;引用资料及用户原始材料不因此变为AI生成。AI assistance: OpenAI Codex. Explanations, rewriting, English translation or layout include AI-generated work; cited and supplied source materials retain their own provenance.
教材对应:第6章Textbook: Chapter 6
学习要点 · 用通俗的话回顾Learning recap in plain language
拿到数据不等于得到结论。先检查采样、误差和单位,再决定用平均、频谱还是EOF;分析工具应该服务于具体问题。Data require checks on sampling, errors and units before selecting averages, spectra or EOFs. Methods should serve the question.
疑问与解惑记录 1|使用智能体解决问题Question and resolution 1 | Using an agent to solve problems
① 当时没听懂/有疑问的点① My question
需要解决的问题是:怎样借助工具处理学习中遇到的问题?这段经历的重点是学习一种新的解决途径。The learning question was how to use tools to address study problems; this experience concerns a new problem-solving approach.
② 后来怎么解决② How I addressed it
我在课堂上学习了使用智能体解决问题。I learned in class to use an agent to help solve problems.
③ 现在怎么理解③ My understanding now
这次课让我掌握了一种可以借助的工具。现在遇到学习问题时,除了查资料和请教别人,我也可以借助智能体辅助整理和分析,再核对它给出的解释。I gained another tool for learning: alongside references and discussion, an agent can help organize and analyze a question, with its explanation checked afterward.
经历依据作者补充;文字与英文翻译由OpenAI Codex辅助整理。Based on the author’s account; wording and translation assisted by OpenAI Codex.
AI辅助整理:OpenAI Codex|本节的解释、中文改写、英文翻译或网页编排含AI生成内容;引用资料及用户原始材料不因此变为AI生成。AI assistance: OpenAI Codex. Explanations, rewriting, English translation or layout include AI-generated work; cited and supplied source materials retain their own provenance.
教材对应:第7章Textbook: Chapter 7
学习要点 · 用通俗的话回顾Learning recap in plain language
看海流方向要先明确坐标、半球和受力。地转平衡、艾克曼输运和Sverdrup平衡适用的层次不同,不能把一个方向规则用到所有海流上。Flow interpretation starts with coordinates, hemisphere and forces. Geostrophic, Ekman and Sverdrup balances apply to different aspects of circulation.
疑问与解惑记录 2|湾流剖面图:怎样判断流向?Question and resolution 2 | How to determine Gulf Stream flow direction
① 当时没听懂/有疑问的点① My question
我当时没弄明白的是:湾流剖面图上有密度、动力高度和速度曲线,到底应该根据什么判断海水往哪个方向流?My confusion was how to infer flow direction from the density, dynamic-height and velocity profiles in the Gulf Stream section.
② 后来怎么解决② How I addressed it
后来通过课堂讨论,我对这个问题有了更清楚的理解。Classroom discussion helped me understand the question more clearly.
③ 现在怎么理解③ My understanding now
现在我会先看站位和剖面方向,再比较动力高度。北半球沿着流向看,高动力高度在右侧。图中南侧A的上层动力高度高于北侧B,所以在近似南北剖面下对应向东流;速度曲线向右伸展表示数值,不代表海水沿剖面向右流。I now establish the section orientation and compare dynamic heights. Higher dynamic height is on the right looking downstream in the Northern Hemisphere. Southern A is higher than northern B in the upper ocean, implying eastward flow for an approximately north–south section. A rightward speed profile shows values, not flow along the section.
经历依据作者补充;文字与英文翻译由OpenAI Codex辅助整理。Based on the author’s account; wording and translation assisted by OpenAI Codex.
疑问与解惑记录 3|Sverdrup平衡:怎样把几个过程连起来?Question and resolution 3 | Connecting the processes in Sverdrup balance
① 当时没听懂/有疑问的点① My question
我当时对Sverdrup平衡的理解还不清楚,需要把风驱动、艾克曼输运和内部海流放在一起理解。I did not yet clearly understand Sverdrup balance and needed to connect wind forcing, Ekman transport and interior circulation.
② 后来怎么解决② How I addressed it
后来经过同学和老师的讲解,我逐渐把这些过程联系起来。Explanations from classmates and the teacher helped me connect the processes.
③ 现在怎么理解③ My understanding now
现在我把它理解为一条过程链:风引起艾克曼输运的辐合或辐散,影响下方水柱的压缩或拉伸;在大尺度海盆内区近似下,这与南北移动带来的行星涡度变化相联系。这样理解后,公式中的风应力旋度与经向输运就有了物理联系,而不只是要背的符号。I now connect Ekman convergence or divergence to compression or stretching below, and—under the large-scale interior approximation—to planetary-vorticity changes through meridional motion. This gives a physical meaning to the relationship between wind-stress curl and meridional transport.
经历依据作者补充;文字与英文翻译由OpenAI Codex辅助整理。Based on the author’s account; wording and translation assisted by OpenAI Codex.
AI辅助整理:OpenAI Codex|本节的解释、中文改写、英文翻译或网页编排含AI生成内容;引用资料及用户原始材料不因此变为AI生成。AI assistance: OpenAI Codex. Explanations, rewriting, English translation or layout include AI-generated work; cited and supplied source materials retain their own provenance.
教材对应:第8章Textbook: Chapter 8
学习要点 · 用通俗的话回顾Learning recap in plain language
波形传播不等于整团海水一直随波前进。潮汐和近岸运动还受海岸、地形与河流输入影响,需要把周期变化与净输运分开看。Wave propagation differs from continuous parcel transport. Coastal geometry, bathymetry and river input affect tides and coastal circulation.
AI辅助整理:OpenAI Codex|本节的解释、中文改写、英文翻译或网页编排含AI生成内容;引用资料及用户原始材料不因此变为AI生成。AI assistance: OpenAI Codex. Explanations, rewriting, English translation or layout include AI-generated work; cited and supplied source materials retain their own provenance.
海洋热量收支与混合层|9题中英双语解析Ocean Heat Budget and Mixed Layer | Nine Bilingual Explanations
课程复习 · 中文理解 · 英文作答Course revision · Chinese explanations · English answers
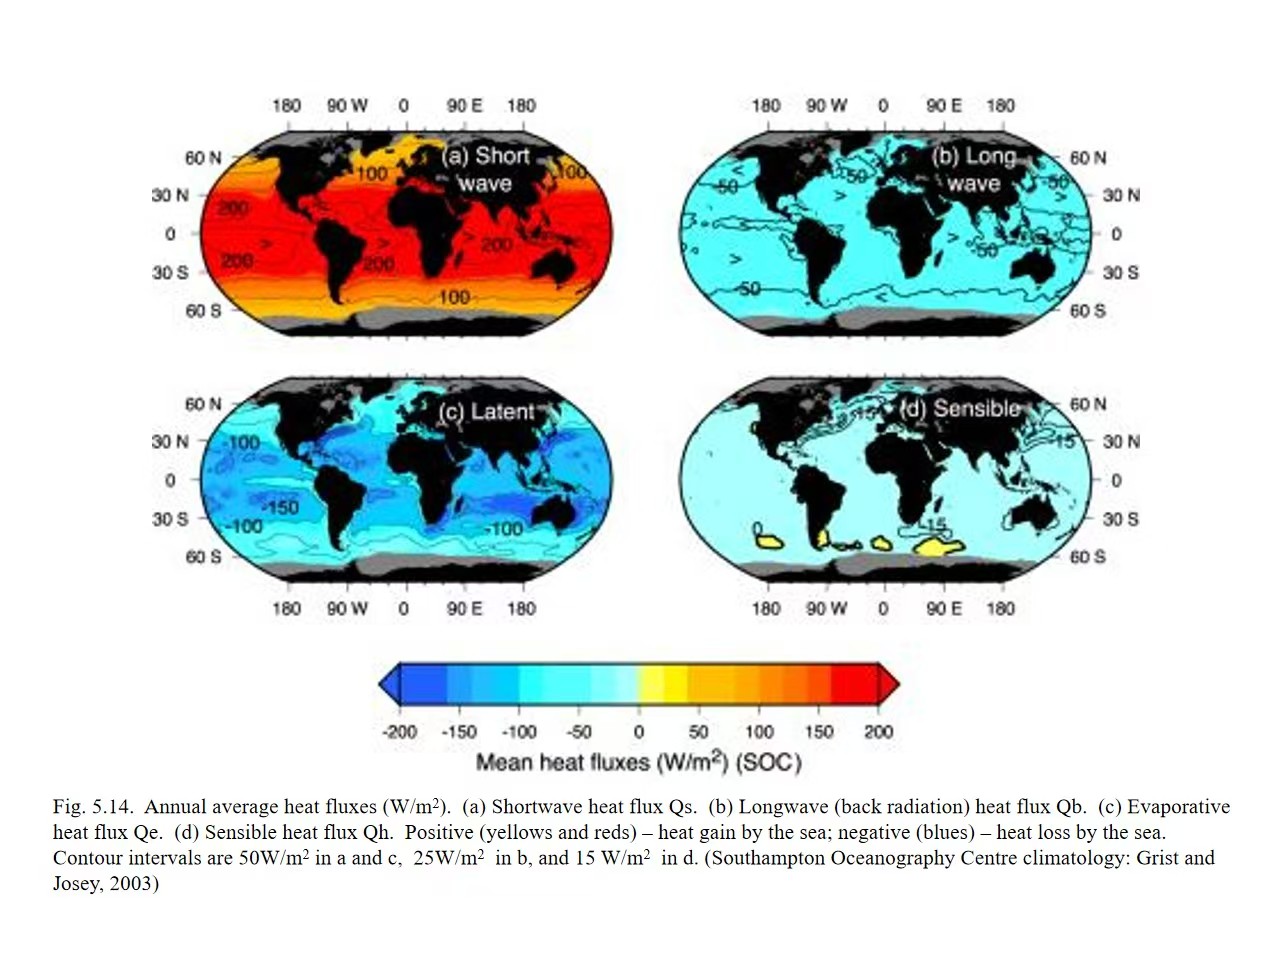
使用说明:前两题对应海表热收支,后七题对应混合层、盐度、温跃层。热通量第二题以提供的 Fig. 5.14(Southampton Oceanography Centre climatology, Grist and Josey, 2003)作估读;图像清晰度有限,不能把估读值视为精确全球极值。The first two questions address the surface heat budget; the remaining seven cover the mixed layer, salinity and thermocline. Question 2 uses approximate readings from Fig. 5.14 (Southampton Oceanography Centre climatology; Grist and Josey, 2003). The limited image resolution does not support precise global extrema.
重要的符号约定Sign Convention
AI辅助整理:OpenAI Codex|本节的解释、中文改写、英文翻译或网页编排含AI生成内容;引用资料及用户原始材料不因此变为AI生成。AI assistance: OpenAI Codex. Explanations, rewriting, English translation or layout include AI-generated work; cited and supplied source materials retain their own provenance.
本文按题目提供的 Fig. 5.14:正值表示海洋净获得热量(向下为正),负值表示海洋净失去热量(向上为负)。因此图中的 Qb、Qe、Qh 多为负;部分教科书将“海洋向大气的损失”定义为正值,不能混用。Following Fig. 5.14, positive values represent ocean heat gain (downward positive), while negative values represent ocean heat loss. Qb, Qe and Qh are therefore mostly negative. Some textbooks define upward ocean heat loss as positive; these conventions must not be mixed.
第1题 · 热通量影响因素Question 1 · Heat-flux controls
AI辅助整理:OpenAI Codex|本节的解释、中文改写、英文翻译或网页编排含AI生成内容;引用资料及用户原始材料不因此变为AI生成。AI assistance: OpenAI Codex. Explanations, rewriting, English translation or layout include AI-generated work; cited and supplied source materials retain their own provenance.
Original question|英文原题
What factors determine the heat budget terms, Qs, Qb, Qe and Qh, respectively? Make clear the importance of each factor of each term.
中文翻译Chinese Translation
分别有哪些因素决定短波辐射 Qs、净长波辐射 Qb、潜热通量 Qe 和感热通量 Qh?说明各因素的重要性。
知识点解析Explanation
Qs|短波辐射:太阳高度角(纬度、季节、一天中的时间)和云量是主要控制因素;日照时数决定日平均和季节平均入射量;海面反照率决定反射比例。太阳高度角高、少云时,海洋吸收短波辐射通常更多。Qs — Shortwave radiation: Solar elevation (latitude, season and time of day) and cloud cover are the main controls. Day length affects daily and seasonal mean input, and surface albedo determines the reflected fraction. Higher solar elevation and fewer clouds generally increase absorbed shortwave radiation.
Qb|净长波辐射:由海面向上的红外辐射和大气向下的长波辐射之差决定。SST 影响海面的向上发射(近似与绝对温度的四次方相关);云量、大气温度和水汽含量影响向下辐射。云和水汽多时通常减弱海洋净长波热损失。Qb — Net longwave radiation: The balance between upward infrared emission from the sea surface and downward atmospheric radiation. SST controls upward emission, approximately proportional to the fourth power of absolute temperature. Clouds, air temperature and water vapour affect downward radiation; more clouds and water vapour usually reduce net ocean longwave heat loss.
Qe|蒸发潜热:风速和海表饱和比湿与近海面空气比湿之差是直接控制因素;SST 通过提高海表饱和水汽压改变湿度差。较强风、较干空气和较暖海水通常导致更强蒸发及海洋热损失。Qe — Evaporative latent heat: Wind speed and the difference between saturation specific humidity at the sea surface and near-surface air humidity are the direct controls. SST affects this difference through saturation vapour pressure. Stronger winds, drier air and warmer water generally increase evaporation and ocean heat loss.
Qh|感热:海气温差(SST−近海面气温)与风速为主要因素;大气稳定度也改变湍流交换效率。海面比空气暖时海洋通常损失感热;海面较冷时可得到感热。Qh — Sensible heat: Wind speed and the sea–air temperature difference are the main controls; atmospheric stability affects turbulent exchange. A warmer sea usually loses sensible heat to the air, while a colder sea can gain sensible heat.
英文参考答案English Reference Answer
Qs is mainly governed by solar elevation (latitude, season and time of day), cloud cover, day length and sea-surface albedo; solar geometry and clouds are particularly important. Qb is controlled by sea-surface temperature and downward atmospheric longwave radiation, which strongly depends on cloud cover, air temperature and humidity. Qe is primarily determined by wind speed and the air–sea humidity difference, with SST affecting saturation humidity. Qh mainly depends on wind speed, the air–sea temperature difference and atmospheric stability.
第2题 · 通量范围与极值Question 2 · Flux ranges and extrema
AI辅助整理:OpenAI Codex|本节的解释、中文改写、英文翻译或网页编排含AI生成内容;引用资料及用户原始材料不因此变为AI生成。AI assistance: OpenAI Codex. Explanations, rewriting, English translation or layout include AI-generated work; cited and supplied source materials retain their own provenance.
Original question|英文原题
What are the ranges of the magnitude of the four terms? For each term, please specify the location and value of the maximum and minimum center.
中文翻译Chinese Translation
四种热通量的数值范围是多少?各自最大值和最小值中心在哪里,数值约为多少?
依据|Fig. 5.14Basis | Fig. 5.14
依据课程提供的全球海洋年平均热通量分布图;单位均为 W/m²。该图中 a/c 等值线间隔约 50,b 为 25,d 为 15 W/m²。以下位置与数值仅为图上近似估读(尤其是 Qb、Qh)。Based on the course figure of global annual-mean ocean heat fluxes. All values are in W/m². Contour intervals are approximately 50 for panels a/c, 25 for b and 15 W/m² for d. Locations and values are approximate visual estimates, particularly for Qb and Qh.
Fig. 5.14. 全球海洋年平均热通量分布;图片由课程资料提供。Fig. 5.14. Global annual-mean ocean heat fluxes; image supplied in the course materials.
图上估读数值(W/m²),向海洋为正Approximate figure readings (W/m²); positive into the ocean
项目Term
图示大致范围Approximate range
最大值中心(带符号)Maximum centre (signed value)
最小值中心(带符号)Minimum centre (signed value)
Qs 短波Qs — Shortwave
约 0~250Approx. 0 to 250
南太平洋/南印度洋副热带少云区,约 +200~+250Relatively cloud-free subtropical South Pacific / South Indian Ocean; approx. +200 to +250
南极周边高纬海域,约 0~+50High latitudes around Antarctica; approx. 0 to +50
Qb 长波Qb — Longwave
约 −100~0Approx. −100 to 0
赤道及多云湿润海域,约 −25~0(损失小)Equatorial and cloudy, humid regions; approx. −25 to 0 (small loss)
较干燥的副热带海域,约 −75~−100(损失大)Dry subtropical regions; approx. −75 to −100 (large loss)
Qe 潜热Qe — Latent heat
约 −200~0Approx. −200 to 0
部分高纬、弱蒸发海域,约 0~−50Some high-latitude regions with weak evaporation; approx. −50 to 0
湾流及黑潮延伸区等强蒸发海域,约 −150~−200Strong evaporation over the Gulf Stream and Kuroshio extensions; approx. −200 to −150
Qh 感热Qh — Sensible heat
约 −60~+15Approx. −60 to +15
南大洋局部海域,约 0~+15Parts of the Southern Ocean; approx. 0 to +15
湾流和黑潮附近,约 −45~−60Near the Gulf Stream and Kuroshio; approx. −60 to −45
辨析:题目“maximum / minimum”按带正负号的数学大小定义。比如 Qe 最大值是接近 0 的区域,而“最强蒸发热损失”对应最小值 −200 左右。图中没有明确标注每个极值中心的精确经纬度,所以不宜虚构具体坐标。Maximum and minimum refer to signed numerical values. For Qe, the maximum occurs near zero; the strongest evaporative heat loss corresponds to a minimum of around −200. The figure does not label exact coordinates for every extremum, so precise coordinates should not be invented.
英文参考答案English Reference Answer
Based on Fig. 5.14, the approximate annual-mean ranges are Qs: 0 to +250 W/m², Qb: −100 to 0 W/m², Qe: −200 to 0 W/m², and Qh: −60 to +15 W/m². Qs peaks in relatively cloud-free subtropical oceans and approaches zero near Antarctica. Qb reaches its least-negative values in cloudy, humid tropical regions and its most-negative values in dry subtropical oceans. Qe is closest to zero in regions of weak evaporation and most negative over western boundary currents such as the Gulf Stream and Kuroshio. Qh can be weakly positive in parts of the Southern Ocean and is most negative near the Gulf Stream and Kuroshio. Locations and magnitudes are approximate readings from the figure.
第3题 · 混合层深度Question 3 · Mixed-layer depth
AI辅助整理:OpenAI Codex|本节的解释、中文改写、英文翻译或网页编排含AI生成内容;引用资料及用户原始材料不因此变为AI生成。AI assistance: OpenAI Codex. Explanations, rewriting, English translation or layout include AI-generated work; cited and supplied source materials retain their own provenance.
Original question|英文原题
How deep is a typical mixed layer if mixed by wind? How deep can it reach if driven by cooling?
中文翻译Chinese Translation
风驱动形成的典型混合层有多深?如果由表面冷却驱动,混合层最深可达到多少?
知识点解析Explanation
风驱动:典型风生混合层为数十米,常用参考量级约 10–50 m;强风和风暴条件下可达到约 100 m 或更深。Wind-driven mixing: The typical depth is a few tens of metres, often about 10–50 m. Strong winds and storms can deepen the mixed layer to roughly 100 m or more.
冷却驱动:海面失热使表层海水密度增大,触发对流;冬季混合层常可达到 100–500 m,在深对流区如拉布拉多海、格陵兰海及南大洋局部,极端情况下可超过 1000 m,甚至达到约 2000 m 量级。Cooling-driven mixing: Surface heat loss increases water density and triggers convection. Winter mixed layers can commonly reach 100–500 m. In deep-convection regions such as the Labrador Sea, Greenland Sea and parts of the Southern Ocean, extreme cases can exceed 1,000 m and approach 2,000 m.
注意:深度不是固定常数,取决于原有层结、浮力通量、风与海流等。These depths are not fixed constants; they depend on existing stratification, buoyancy fluxes, winds and currents.
英文参考答案English Reference Answer
Wind mixing typically produces a mixed layer of a few tens of meters (roughly 10–50 m), although storms can deepen it beyond 100 m. Surface cooling increases surface-water density and can drive much deeper convective mixing: hundreds of meters in winter, and occasionally over 1,000 m (locally approaching 2,000 m) in deep-convection regions.
第4题 · 温盐垂直剖面Question 4 · Vertical temperature and salinity profiles
AI辅助整理:OpenAI Codex|本节的解释、中文改写、英文翻译或网页编排含AI生成内容;引用资料及用户原始材料不因此变为AI生成。AI assistance: OpenAI Codex. Explanations, rewriting, English translation or layout include AI-generated work; cited and supplied source materials retain their own provenance.
Original question|英文原题
What are the typical vertical temperature and salinity profiles in the subtropical and subpolar regions of the North Pacific?
中文翻译Chinese Translation
北太平洋副热带和副极地海区的典型温度与盐度垂直剖面分别有什么特点?
知识点解析Explanation
副热带温度:表层暖;表层混合层下有明显温跃层,温度随深度迅速下降;深层低温且变化缓慢。Subtropical temperature: Warm surface water overlies a distinct thermocline below the mixed layer, where temperature decreases rapidly. Deep water is cold and varies more slowly with depth.
副热带盐度:表层通常较咸,或在表层下出现盐度极大值;其下有较淡的中层水(如北太平洋中层水的盐度极小值),再向深层变化较小。Subtropical salinity: Surface water is often relatively saline, or there is a near-surface salinity maximum. Fresher intermediate water, such as the salinity minimum of North Pacific Intermediate Water, lies below; deeper salinity changes are smaller.
副极地温度:表面冷,温度的垂向变化一般弱于副热带;一些海区存在冷淡表层下方的次表层温度最大值或逆温结构。Subpolar temperature: Surface water is cold and the vertical temperature contrast is generally weaker than in the subtropics. Some regions have a subsurface temperature maximum or inversion below the cold, fresh surface layer.
副极地盐度:由于降水和其他淡水输入,表层较淡;盐度一般随深度增加,形成显著盐跃层,盐度分层可主导密度稳定性。Subpolar salinity: Rainfall and other freshwater inputs produce a fresh surface layer. Salinity generally increases with depth across a pronounced halocline; salinity stratification can dominate density stability.
英文参考答案English Reference Answer
In the subtropical North Pacific, surface waters are warm and relatively saline. Temperature decreases rapidly through a strong thermocline. Salinity often exhibits a near-surface maximum and a subsurface/intermediate minimum. In the subpolar North Pacific, surface waters are colder and fresher; the thermocline is weak or may include a subsurface temperature inversion. Salinity generally increases with depth across a pronounced halocline, which helps maintain stratification.
第5题 · 净蒸发区域Question 5 · Net evaporation regions
AI辅助整理:OpenAI Codex|本节的解释、中文改写、英文翻译或网页编排含AI生成内容;引用资料及用户原始材料不因此变为AI生成。AI assistance: OpenAI Codex. Explanations, rewriting, English translation or layout include AI-generated work; cited and supplied source materials retain their own provenance.
Original question|英文原题
What are the dominant regions of net evaporation in the ocean?
中文翻译Chinese Translation
全球海洋哪些区域以净蒸发(蒸发量 E 大于降水量 P)为主?
知识点解析Explanation
主要位置:南北半球约 15°–35° 的副热带海域,尤其副热带高压带下少云、降水较少的海区,包括副热带北大西洋、南大西洋、南印度洋及太平洋大范围海域。Main regions: Subtropical oceans at roughly 15°–35° in both hemispheres, especially low-rainfall, relatively cloud-free areas beneath subtropical highs. These include large areas of the North and South Atlantic, southern Indian Ocean and Pacific.
成因:副热带下沉气流抑制降水,信风及较暖水温有利于蒸发;因此 E−P > 0。Mechanism: Subtropical descending air suppresses rainfall, while trade winds and warm water favour evaporation. Consequently, E−P > 0.
对比:赤道辐合带(ITCZ)和很多高纬区域通常净降水更显著,不能把“潜热损失强”与“净蒸发最大”直接等同。Contrast: The ITCZ and many high-latitude regions are dominated by net precipitation. Strong latent heat loss is not necessarily the same as the greatest net evaporation.
英文参考答案English Reference Answer
Net evaporation (E > P) dominates mainly in the subtropical ocean belts, roughly 15°–35° north and south, especially beneath subtropical high-pressure systems. These regions experience relatively low rainfall and substantial evaporation. In contrast, the equatorial rain belt and many high-latitude regions generally have net precipitation.
第6题 · 混合层热收支Question 6 · Mixed-layer heat budget
AI辅助整理:OpenAI Codex|本节的解释、中文改写、英文翻译或网页编排含AI生成内容;引用资料及用户原始材料不因此变为AI生成。AI assistance: OpenAI Codex. Explanations, rewriting, English translation or layout include AI-generated work; cited and supplied source materials retain their own provenance.
Original question|英文原题
What are the key components of the Mixed Layer heat budget?
中文翻译Chinese Translation
海洋混合层热收支的主要组成部分有哪些?
知识点解析Explanation
海表净热通量:太阳短波、净长波、潜热和感热四项之和,即 Qnet = Qs + Qb + Qe + Qh(按本题向海洋为正)。Net surface heat flux: The sum of shortwave, net longwave, latent and sensible heat fluxes: Qnet = Qs + Qb + Qe + Qh, with positive values directed into the ocean.
水平平流:海流输送不同温度的水,造成混合层增暖或降温。Horizontal advection: Currents transport water of different temperatures, warming or cooling the mixed layer.
底部交换:混合层底部的卷入(entrainment)、湍流扩散和垂向平流将上下层热量相互交换。Exchange at the base: Entrainment, turbulent diffusion and vertical advection exchange heat between the mixed layer and deeper water.
混合层深度变化:混合层深度 h 变化影响相同热通量造成的温度变化幅度;还有太阳短波穿透到混合层底以下的能量需要扣除。Changing mixed-layer depth: Depth h affects the temperature response to a given heat flux. Shortwave energy penetrating below the mixed-layer base must also be excluded from the heat retained in the layer.
英文参考答案English Reference Answer
The mixed-layer heat budget includes (1) net air–sea surface heat flux (shortwave, longwave, latent and sensible heat), (2) horizontal heat advection by currents, (3) vertical exchange across the mixed-layer base, including entrainment and turbulent mixing, and (4) changes in mixed-layer depth and penetrative shortwave radiation. Together these terms determine the time rate of change of mixed-layer temperature.
第7题 · 大西洋与太平洋盐度Question 7 · Atlantic and Pacific salinity
AI辅助整理:OpenAI Codex|本节的解释、中文改写、英文翻译或网页编排含AI生成内容;引用资料及用户原始材料不因此变为AI生成。AI assistance: OpenAI Codex. Explanations, rewriting, English translation or layout include AI-generated work; cited and supplied source materials retain their own provenance.
Original question|英文原题
Is the North Atlantic Ocean saltier or fresher on average than the Pacific? Why?
中文翻译Chinese Translation
北大西洋平均而言比太平洋更咸还是更淡?为什么?
知识点解析Explanation
结论:北大西洋总体上比北太平洋更咸,尤其在副热带及高纬北大西洋很明显。Conclusion: The North Atlantic is generally saltier than the North Pacific, particularly in subtropical and high-latitude North Atlantic regions.
原因一:大西洋流域总体蒸发相对于降水和径流更强,且水汽可通过大气向太平洋及其他流域输送,相当于从大西洋移走淡水。Reason 1: Evaporation is stronger relative to rainfall and runoff in the Atlantic basin. Atmospheric moisture transport to the Pacific and other basins effectively exports freshwater from the Atlantic.
原因二:较咸的表层海水在北大西洋高纬冷却后可变得足够密,利于深水形成,是大西洋经向翻转环流的重要条件;这是与盐度分布相关的环流反馈,而不是唯一成因。Reason 2: Saline surface water can become sufficiently dense when cooled at high northern latitudes, facilitating deep-water formation and the Atlantic overturning circulation. This is a circulation feedback associated with salinity, rather than its sole cause.
英文参考答案English Reference Answer
The North Atlantic is saltier on average than the North Pacific. The Atlantic has a stronger basin-scale freshwater deficit because evaporation tends to exceed the freshwater input from precipitation and runoff, and atmospheric moisture transport exports freshwater from the Atlantic basin. The relatively high salinity also facilitates deep-water formation in the northern North Atlantic.
第8题 · 季节变化Question 8 · Seasonal variability
AI辅助整理:OpenAI Codex|本节的解释、中文改写、英文翻译或网页编排含AI生成内容;引用资料及用户原始材料不因此变为AI生成。AI assistance: OpenAI Codex. Explanations, rewriting, English translation or layout include AI-generated work; cited and supplied source materials retain their own provenance.
Original question|英文原题
What regions of the ocean are characterized by large differences from summer to winter? What regions have the least seasonal variability?
中文翻译Chinese Translation
全球海洋哪些海域夏冬差异最大?哪些海域季节变化最小?
知识点解析Explanation
季节变化大:中高纬度海洋,尤其北半球中纬度西边界流区及其延伸区(湾流、黑潮)和北大西洋、北太平洋的部分海域;表层温度、海气热通量和混合层深度的季节对比突出。Large seasonal changes: Mid- and high-latitude oceans, especially Northern Hemisphere western boundary currents and their extensions (Gulf Stream and Kuroshio), and parts of the North Atlantic and North Pacific. SST, air–sea heat flux and mixed-layer depth show strong seasonal contrasts.
季节变化小:赤道附近和低纬热带开阔海域,由于全年太阳高度角与日长的季节差异较小,海表温度的季节循环通常较弱。Small seasonal changes: Equatorial and tropical open oceans, where seasonal changes in solar elevation and day length are smaller; the SST seasonal cycle is generally weaker.
限定:如讨论的是混合层深度,热带仍有风、降水和 ENSO 等变化;如果讨论温度,季风海区和强上升流区也会有明显季节性。Qualifications: Tropical mixed-layer depth still responds to winds, rainfall and ENSO. Monsoon regions and strong upwelling regions can also exhibit substantial seasonal temperature changes.
英文参考答案English Reference Answer
The strongest summer-to-winter contrasts generally occur in the mid- and high-latitude oceans, especially along and downstream of western boundary currents such as the Gulf Stream and Kuroshio. These regions show strong seasonal changes in sea-surface temperature, air–sea heat flux and mixed-layer depth. The weakest seasonal cycle is generally found in the tropical and equatorial open oceans, although monsoons and upwelling can cause important regional exceptions.
第9题 · 温跃层维持机制Question 9 · Thermocline maintenance
AI辅助整理:OpenAI Codex|本节的解释、中文改写、英文翻译或网页编排含AI生成内容;引用资料及用户原始材料不因此变为AI生成。AI assistance: OpenAI Codex. Explanations, rewriting, English translation or layout include AI-generated work; cited and supplied source materials retain their own provenance.
Original question|英文原题
Please describe the two processes that maintain the thermocline.
中文翻译Chinese Translation
请描述维持温跃层的两种主要过程。
知识点解析Explanation
过程一|表面加热与浮力层结:太阳辐射加热表层,使暖而轻的水覆盖冷而密的下层水;较稳定的密度层结限制垂直混合,形成或强化上部温跃层,季节性温跃层尤其明显。Process 1 — Surface heating and buoyancy stratification: Solar heating places warm, light water above cold, dense water. Stable density stratification restricts vertical mixing and forms or strengthens the upper thermocline, especially the seasonal thermocline.
过程二|风驱动环流与水体潜沉:副热带环流中的 Ekman 辐合与下沉,以及露出海面的密度面上水团的冬季通气、侧向输送和潜沉(subduction),将表面形成的温度/密度结构带入海洋内部,帮助维持大尺度永久温跃层。Process 2 — Wind-driven circulation and subduction: Ekman convergence and downwelling in subtropical gyres, together with winter ventilation, lateral transport and subduction along outcropping density surfaces, carry surface temperature and density structures into the ocean interior and help maintain the permanent thermocline.
维持平衡:从更长期的观点看,内部上升流、湍流/跨密度面混合及平流共同调节温跃层深度和形态。这里两条分别强调“热力分层”与“风驱动动力过程”。Long-term balance: Interior upwelling, turbulent/diapycnal mixing and advection jointly regulate thermocline depth and shape. The two processes above emphasize thermal stratification and wind-driven dynamics.
英文参考答案English Reference Answer
Two key processes are (1) surface buoyancy forcing, especially solar heating, which makes warm, light water overlie colder, denser water and suppresses vertical mixing; and (2) wind-driven circulation and subduction, including Ekman convergence/downwelling and the ventilation of subtropical thermocline waters. These mechanisms create and sustain the thermal stratification, while interior mixing and upwelling help balance the large-scale circulation.
速记与答题提醒Revision Notes
AI辅助整理:OpenAI Codex|本节的解释、中文改写、英文翻译或网页编排含AI生成内容;引用资料及用户原始材料不因此变为AI生成。AI assistance: OpenAI Codex. Explanations, rewriting, English translation or layout include AI-generated work; cited and supplied source materials retain their own provenance.
① 按给定图的符号:Qs 多为正,Qb/Qe/Qh 多为负。② 潜热损失的“绝对值最大”与“带符号的最小值”是同一强蒸发位置。③ 净蒸发看 E−P,不等同于 Qe 的极值。④ 风混合通常数十米;冬季深对流可达数百至千米以上。⑤ 混合层热收支不只有海气热通量,还包括海流平流与混合层底部交换。1. With this sign convention, Qs is mainly positive and Qb/Qe/Qh mainly negative. 2. Maximum latent heat-loss magnitude corresponds to the most negative signed flux. 3. Net evaporation depends on E−P, not simply on extrema of Qe. 4. Wind mixing usually reaches tens of metres; winter deep convection can reach hundreds to over a thousand metres. 5. The mixed-layer heat budget also includes current advection and exchange at the layer base.
参考图:Grist, J. P. & Josey, S. A. (2003), Southampton Oceanography Centre air–sea flux climatology(图由课程材料提供,原图题为 Annual average heat fluxes)。极值位置是依据所提供的低分辨率图片估读。Reference figure: Grist, J. P. & Josey, S. A. (2003), Southampton Oceanography Centre air–sea flux climatology. The course-supplied figure is titled Annual average heat fluxes. Extremum locations are estimated from the low-resolution image.
数据分析的四类基本概念与方法Four Basic Concepts and Methods of Data Analysis
AI辅助整理:OpenAI Codex|本节的解释、中文改写、英文翻译或网页编排含AI生成内容;引用资料及用户原始材料不因此变为AI生成。AI assistance: OpenAI Codex. Explanations, rewriting, English translation or layout include AI-generated work; cited and supplied source materials retain their own provenance.
以下结合海洋学例子,说明基础统计、时间序列分析、客观分析和 EOF 分析各自解决的问题。Oceanographic examples illustrate the different questions addressed by statistics, time-series analysis, objective analysis and EOF analysis.
AI辅助整理:OpenAI Codex|本节的解释、中文改写、英文翻译或网页编排含AI生成内容;引用资料及用户原始材料不因此变为AI生成。AI assistance: OpenAI Codex. Explanations, rewriting, English translation or layout include AI-generated work; cited and supplied source materials retain their own provenance.
用来描述数据的平均状态、波动大小,以及不同变量之间的关系。These concepts describe average conditions, the magnitude of variability, and relationships between variables.
随机误差(random error):测量结果不规则地偏高或偏低。例如,同一水温反复测量得到略有不同的结果。独立重复测量取平均通常能减小它的影响。Random error: Irregular positive or negative measurement deviations. Repeated measurements of the same water temperature may differ slightly. Averaging independent measurements generally reduces its influence.
系统误差(systematic error):测量存在持续的偏差。例如,温度计总是高出真实值 0.5°C。多测几次取平均也不能消除,需要校准。Systematic error: A persistent measurement bias, such as a thermometer always reading 0.5°C too high. Repeated averaging does not remove it; calibration is required.
均值(mean):数据的平均水平,例如某海域的年平均海温。Mean: The average level of the data, such as annual-mean sea temperature in a region.
方差(variance):数据偏离均值的平方的平均,表示波动大小。总体方差用总体大小作分母;样本方差的常见无偏估计使用 n−1。Variance: The mean squared deviation from the mean, measuring variability. Population variance uses the population size as the denominator; the usual unbiased sample estimate uses n−1.
标准差(standard deviation):方差的平方根,与原数据单位相同,更方便理解波动幅度。Standard deviation: The square root of variance. It has the same units as the original data and is easier to interpret.
协方差(covariance):两个变量是否倾向于一起变化。正值表示通常同增同减,负值表示通常一个增、另一个减。Covariance: Whether two variables tend to vary together. Positive values indicate same-direction variation; negative values indicate opposite-direction variation.
相关系数(correlation):标准化后的协方差,通常指皮尔逊相关系数,范围为 [−1, 1],衡量线性关系的方向和强弱。相关不代表因果;零相关也不一定意味着没有非线性关系。Correlation: Standardized covariance, usually Pearson correlation, ranging from −1 to 1 and measuring linear association. Correlation does not imply causation, and zero correlation does not rule out nonlinear relationships.
2. Time series analysis · 时间序列分析
AI辅助整理:OpenAI Codex|本节的解释、中文改写、英文翻译或网页编排含AI生成内容;引用资料及用户原始材料不因此变为AI生成。AI assistance: OpenAI Codex. Explanations, rewriting, English translation or layout include AI-generated work; cited and supplied source materials retain their own provenance.
研究一个变量如何随时间变化,例如某海域连续几十年的月平均海温。可以研究趋势、周期、时间上的关联等。Time-series analysis studies how a variable changes over time, such as decades of monthly SST. It examines trends, cycles and temporal relationships.
课件重点讲的是其中的频谱分析:把复杂变化分解成不同频率的成分,判断哪些周期最明显。频谱分析是时间序列分析的一种方法,二者不能完全等同。Spectral analysis separates complex variability into frequency components to identify dominant periods. It is one method within time-series analysis, not an exact synonym for it.
一年周期:季节变化。Annual cycle: Seasonal changes.
一天周期:昼夜变化。Daily cycle: Day–night changes.
数年尺度变化:与 ENSO 等过程有关,不一定具有严格固定的周期。Multi-year variability: Processes such as ENSO, which need not have a strictly fixed period.
频率 f 表示单位时间内变化多少次,周期 T 表示一次变化需要多久,二者满足 T = 1/f。分析空间变化时,可以用波数描述空间上的起伏频繁程度,对应波长。Frequency f is the number of cycles per unit time; period T is the duration of one cycle, with T = 1/f. Spatial variations can be described by wavenumber and wavelength.
红谱:低频、缓慢变化的功率较大。白谱:功率谱密度在各频率上大致相同。谱的形状可以帮助理解变化背后的物理过程,但不能单凭谱形确定唯一机制。Red spectrum: Greater power at low frequencies and slow variations. White spectrum: Approximately constant power spectral density across frequencies. Spectral shape can inform physical interpretation but does not uniquely identify a mechanism.
3. Multi-dimensional data analysis · 多维数据分析
AI辅助整理:OpenAI Codex|本节的解释、中文改写、英文翻译或网页编排含AI生成内容;引用资料及用户原始材料不因此变为AI生成。AI assistance: OpenAI Codex. Explanations, rewriting, English translation or layout include AI-generated work; cited and supplied source materials retain their own provenance.
多维数据可以同时涉及经度、纬度、深度和时间。课件在这里主要介绍客观分析(objective analysis):将分布不规则的观测转换成规则网格上的估计值。Multidimensional data may involve longitude, latitude, depth and time. Here, objective analysis estimates values on a regular grid from irregularly distributed observations.
例如,船舶只在部分位置测量了海温,但我们希望得到完整的海温地图,就需要估计没有观测的网格点。估计时会考虑:For example, ships sample temperature at only some locations, but a complete map requires estimates at unobserved grid points. The analysis considers:
空间相关尺度:相隔多远的观测仍能提供有用信息。Spatial correlation scale: How far away an observation still provides useful information.
观测噪声:测量有多可靠。Observation noise: How reliable each measurement is.
观测之间的关系:避免把高度重复的信息算得过重。Relationships among observations: Avoiding excessive weight on highly redundant information.
最终估计常表现为附近观测的加权组合;有背景场时,通常是对观测与背景之差进行加权修正。因此,它不只是简单取最近几个点的平均。An estimate often takes the form of a weighted combination of nearby observations. When a background field is available, weighted observation-minus-background differences provide corrections. This is more than simply averaging the nearest points.
4. Empirical Orthogonal Functions · 经验正交函数分析
AI辅助整理:OpenAI Codex|本节的解释、中文改写、英文翻译或网页编排含AI生成内容;引用资料及用户原始材料不因此变为AI生成。AI assistance: OpenAI Codex. Explanations, rewriting, English translation or layout include AI-generated work; cited and supplied source materials retain their own provenance.
EOF 从大量时空数据中提取主要空间变化模式及其随时间变化的强度。在常见设置下,它对应主成分分析(PCA)。EOF analysis extracts dominant spatial patterns and their time-varying amplitudes from a spatiotemporal dataset. Under common settings it corresponds to principal component analysis (PCA).
例如,分析太平洋多年海温数据,先减去各位置的时间平均海温,得到异常,再将其近似表示为:For a multi-year Pacific temperature dataset, first subtract the temporal mean at each location to obtain anomalies. These can then be approximated as:
T′(x, t) ≈ ∑k EOFk(x) · PCk(t)
EOFk(x):空间模式。描述哪些区域一起变暖,哪些区域一起变冷。EOF_k(x): Spatial pattern, indicating which regions warm or cool together.
PCk(t):时间系数。描述这个模式何时增强、减弱或反向。PC_k(t): Time coefficient, describing when a pattern strengthens, weakens or reverses.
第一模态:解释的数据方差最多;之后的模态依次解释剩余方差。The first mode explains the most variance; later modes explain successively smaller portions of the remaining variance.
“经验”表示模式由实际数据提取,而不是预先指定为正弦波等数学函数;“正交”表示不同空间模式在采用的内积下互相正交。实际海洋网格分析常需要考虑面积权重。Empirical means that the patterns are derived from data rather than prescribed mathematical functions. Orthogonal means the spatial modes have zero inner product under the chosen metric. Ocean grid analyses often require area weighting.
EOF 模式可能对应 ENSO 等物理过程,但方差最大的模式不一定就是某个独立的物理机制。EOF/PCA 与因子分析并不严格等同。EOF patterns may be associated with physical processes such as ENSO, but the mode explaining the most variance is not necessarily an independent physical mechanism. EOF/PCA and factor analysis are not strictly identical.
动画:空间模式 × 时间系数Animation: Spatial Patterns × Time Coefficients
47 秒动画使用 8 个位置、120 个时刻的合成海温异常数据,演示两个 EOF 模式如何随时间系数变化而叠加重建。两个模式分别解释 80% 和 20% 的方差;这是为教学构造的例子,并非实际海洋观测。This 47-second animation uses synthetic temperature anomalies at eight locations and 120 times. Two modes explain 80% and 20% of variance and combine with changing time coefficients to reconstruct the data. It is a teaching example, not actual ocean observations.
动画制作:OpenAI Codex生成及修改Python脚本,Manim Community渲染。中英双语屏幕文字由Codex辅助撰写;无配音,内容为理想化教学示意。Animation: Python scripts generated and revised with OpenAI Codex, rendered with Manim Community. Bilingual text was AI-assisted. Idealized teaching illustration, without narration.
下载 EOF 动画(MP4) · 中文画面说明,无配音。Download EOF animation (MP4) · Chinese on-screen explanations; no narration.
四类方法分别回答什么?What Question Does Each Method Answer?
类别Method
主要问题Main question
基础统计Basic statistics
平均多少?波动多大?变量有什么关系?What is the mean? How large is variability? How are variables related?
时间序列分析Time-series analysis
如何随时间变化?主要周期是什么?How does the variable change over time? What are the dominant periods?
客观分析Objective analysis
怎样用不规则观测估计完整的空间分布?How can irregular observations estimate a complete spatial distribution?
EOF 分析EOF analysis
复杂时空变化中,最主要的模式有哪些?What are the dominant patterns of complex spatiotemporal variability?
海洋热通量Ocean Heat Fluxes
AI辅助整理:OpenAI Codex|本节的解释、中文改写、英文翻译或网页编排含AI生成内容;引用资料及用户原始材料不因此变为AI生成。AI assistance: OpenAI Codex. Explanations, rewriting, English translation or layout include AI-generated work; cited and supplied source materials retain their own provenance.
1. 热通量是什么? / What is heat flux?
热通量表示单位时间穿过单位面积的热能,单位为 W/m²,即 J/(s·m²)。它描述热量传递的速率,不是温度,也不是总热量。通量乘以面积和持续时间才得到传递的能量。Heat flux is the rate of heat transfer per unit area, measured in W/m² or J/(s·m²). It is neither temperature nor total heat. Multiplying a uniform, constant flux by area and duration gives the transferred energy.
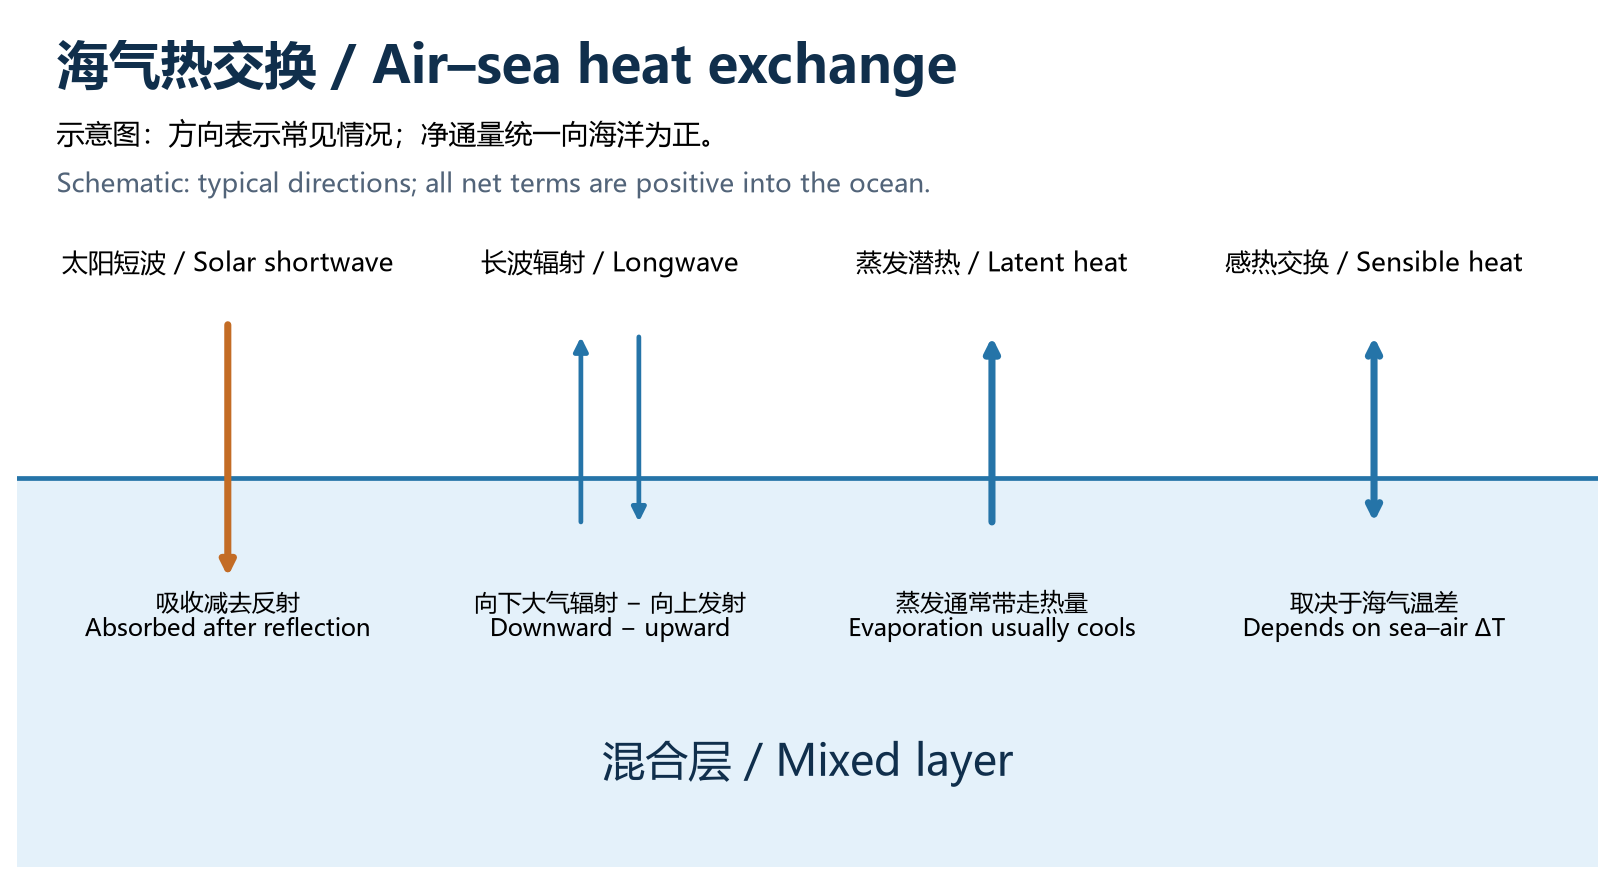
本站统一约定:向海洋为正。Q > 0 表示海洋获得热量,Q < 0 表示海洋失去热量。不同数据集可能采用不同方向,下载数据后要先检查定义和单位。Throughout this site, positive flux is into the ocean: Q > 0 is ocean heat gain and Q < 0 is heat loss. Dataset conventions vary; check direction and units before combining terms.
示意图制作:OpenAI Codex辅助编写Python绘图代码,使用Matplotlib渲染;为教学模型或示意,不是真实观测。OpenAI Codex assisted with Python/Matplotlib code. This is a teaching model or illustration, not an observation.
图 1:四种热交换路径;箭头为示意。Figure 1. Four pathways of heat exchange; arrow directions are schematic.
2. 四项表面热通量 / Four surface heat-flux terms
短波辐射 Qs:主要来自太阳。净短波是到达海面的向下短波减去反射部分,受太阳高度角、日长、云和海面反照率影响;一部分能穿透到混合层以下。Shortwave radiation Qs: Mainly solar energy. Net shortwave equals incoming radiation minus reflection. Solar elevation, day length, clouds and surface albedo matter. Some radiation penetrates below the mixed layer.
净长波辐射 Qb:是大气向下长波与海面向上红外发射之差,常使海洋失热。海温越高,向上发射通常越强;温暖、湿润、多云的大气往往增强向下辐射。Net longwave radiation Qb: Downward atmospheric longwave minus upward ocean infrared emission; it often cools the ocean. Warmer seas emit more, while warm, moist and cloudy atmospheres tend to increase downward radiation.
潜热通量 Qe:水蒸发时吸收能量,通常使海洋失热。关键因素是风速和海面饱和比湿与空气比湿之差;海温会通过饱和比湿影响蒸发。在凝结条件下,方向可能反转。Latent heat flux Qe: Evaporation consumes energy and usually cools the sea. Wind and the sea-surface saturation-to-air humidity difference are key controls; SST influences saturation humidity. Condensation can reverse the direction.
感热通量 Qh:由海气温差引起的湍流热交换。海水比空气暖时,通常向空气放热;空气更暖时可向海水供热。风速与大气稳定度影响交换效率。Sensible heat flux Qh: Turbulent heat exchange associated with the sea–air temperature difference. A warmer sea typically heats the air; warmer air can heat the sea. Wind and atmospheric stability affect exchange efficiency.
3. 符号、公式与热量平衡 / Signs, equations and balance
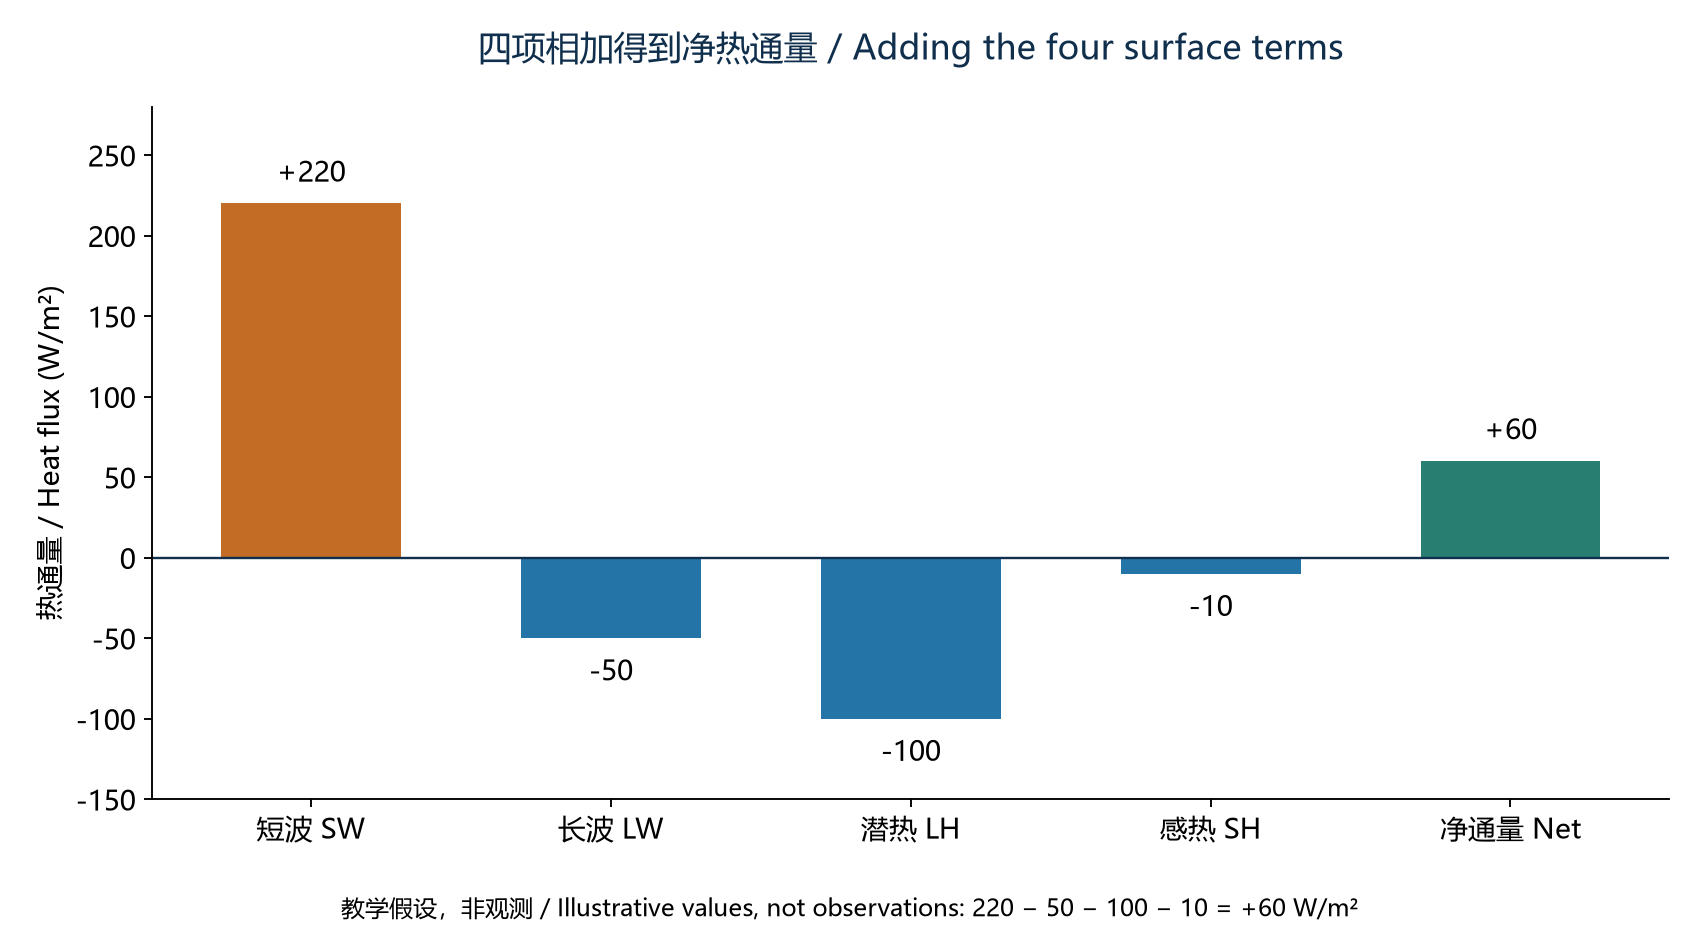
Qnet = Qs + Qb + Qe + Qh
这里四项都已转换为向下为正。如果某资料将长波、潜热和感热的向上损失记为正值 L、E、H,则应写成 Qnet = Qs − L − E − H,不能把两种约定混在同一公式里。All four terms above use downward-positive signs. If a source instead reports upward-positive longwave, latent and sensible losses L, E and H, use Qnet = Qs − L − E − H. Do not mix conventions.
示意图制作:OpenAI Codex辅助编写Python绘图代码,使用Matplotlib渲染;为教学模型或示意,不是真实观测。OpenAI Codex assisted with Python/Matplotlib code. This is a teaching model or illustration, not an observation.
图 2:假设短波 +220、长波 −50、潜热 −100、感热 −10 W/m²,则海洋净获得 +60 W/m²。数值仅为教学示例。Figure 2. Illustrative values of +220, −50, −100 and −10 W/m² sum to a net ocean gain of +60 W/m²; these are not observations.
4. 为什么同样加热,海温反应不同? / Why does temperature respond differently?
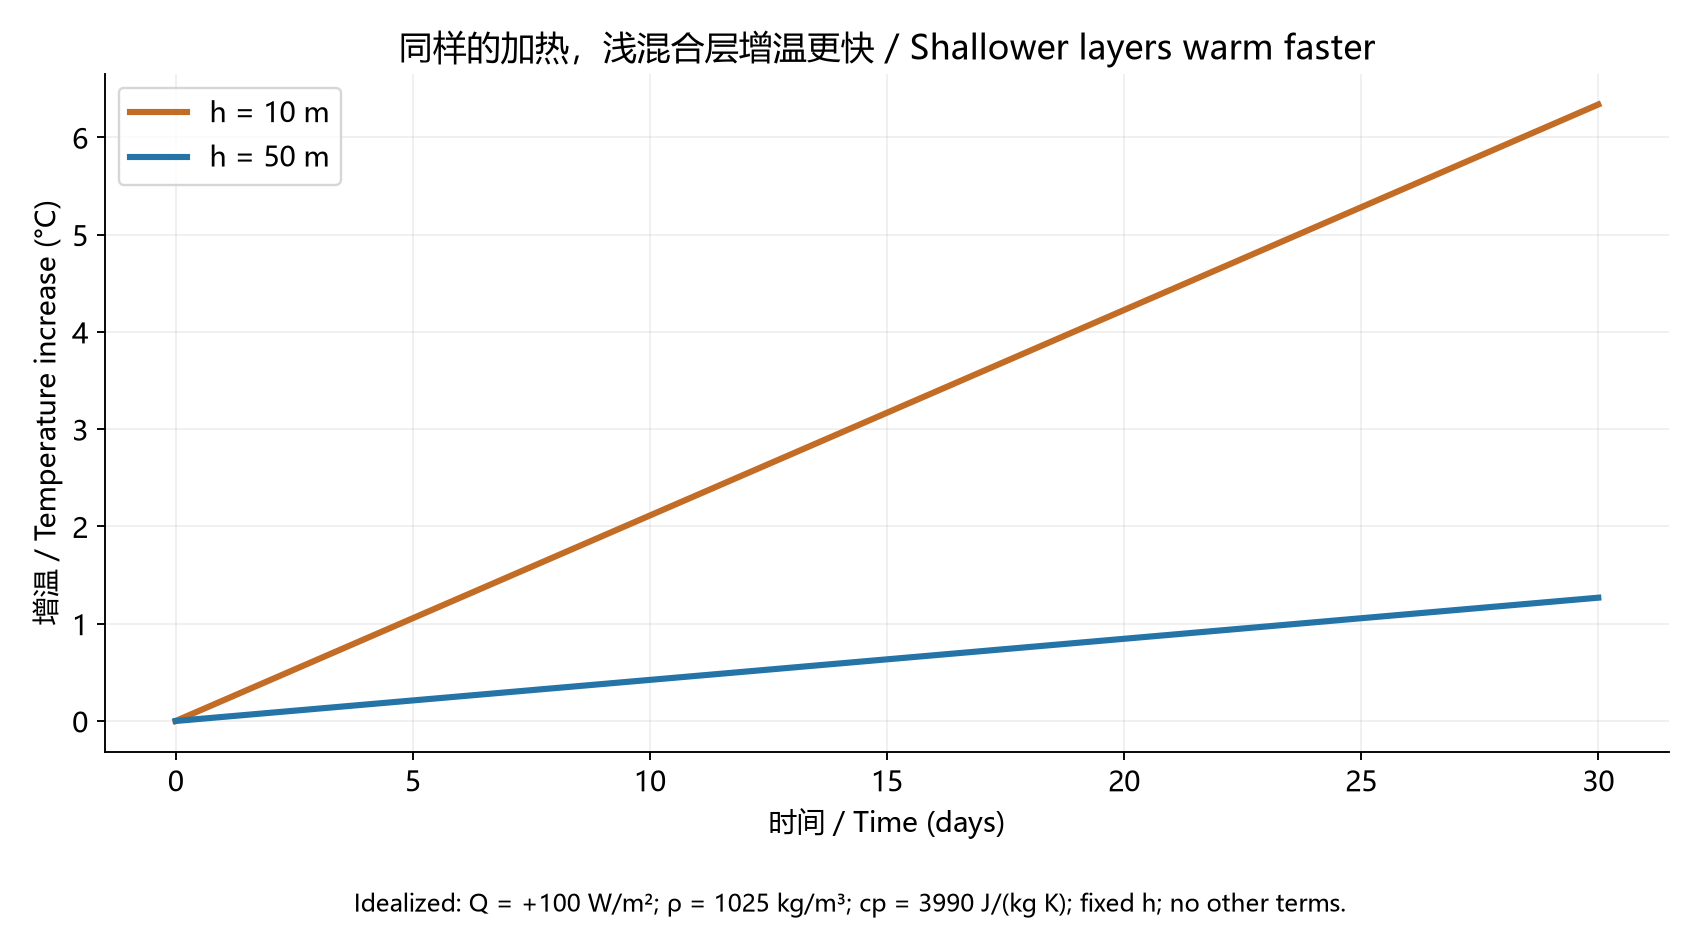
在混合层厚度 h 固定、层内温度均匀,且忽略平流、底部交换和短波穿透的理想条件下:For a fixed-depth, uniformly mixed layer, neglecting advection, exchange at the base and penetrating shortwave radiation:
ΔT = Qnet · Δt / (ρ · cp · h)
ρ 是海水密度,cp 是比热容,h 是混合层厚度。相同热量分配给越薄的水层,温度变化就越大。下图假设持续 +100 W/m²,ρ = 1025 kg/m³、cp = 3990 J/(kg·K):30 天后,10 米水层升温约 6.34°C,50 米水层约 1.27°C。Here ρ is seawater density, cp is specific heat capacity and h is layer depth. The same heat input warms a thinner layer more. With a constant +100 W/m², ρ = 1025 kg/m³ and cp = 3990 J/(kg·K), the 30-day increases are about 6.34°C for 10 m and 1.27°C for 50 m.
示意图制作:OpenAI Codex辅助编写Python绘图代码,使用Matplotlib渲染;为教学模型或示意,不是真实观测。OpenAI Codex assisted with Python/Matplotlib code. This is a teaching model or illustration, not an observation.
图 3:理想热容量实验,不是实际海温预报。真实海温变化会改变通量,混合层深度也会变化。Figure 3. An idealized heat-capacity experiment, not an SST forecast. Real temperature changes feed back on heat fluxes, and mixed-layer depth also changes.
5. 完整混合层热收支 / The full mixed-layer heat budget
净表面通量为正不保证海温立即上升:冷水平流、卷入深层冷水或底部混合都可能抵消加热。计算混合层吸收的热量时,还应从表面净热通量中扣除穿透混合层底部的短波。混合层加深也会改变温度和储热量的关系。Positive surface flux does not guarantee immediate warming: cold-water advection, entrainment and mixing at the base can offset heating. Shortwave radiation passing through the layer base must be subtracted when calculating heat retained by the mixed layer. Deepening also changes the relationship between temperature and heat storage.
6. 观测与数据使用 / Observations and data use
辐射可用辐射计观测;潜热、感热常利用风速、海温、气温和湿度通过海气通量算法估计。常规 Argo 主要测量温盐压力剖面,不能仅靠它直接得到全部表面热通量。使用浮标、卫星或再分析资料时,要核对质量标记、时间平均、空间分辨率及“通量”还是“累计能量”;J/m² 需要除以对应的秒数才能转换为该时段平均 W/m²。Radiometers measure radiation; latent and sensible fluxes are often estimated with bulk algorithms using wind, SST, air temperature and humidity. Standard Argo profiles alone do not directly provide all surface fluxes. Check quality flags, temporal averaging, resolution and whether a variable is flux or accumulated energy. Divide J/m² by the matching accumulation duration in seconds to obtain mean W/m².
本节三图由 Python / Matplotlib 生成。示例参数与假设已在正文及图注中列出。All three figures were generated with Python / Matplotlib. Example parameters and assumptions are stated above and in the captions.
海流动力学:从漂流瓶到地转平衡Ocean Current Dynamics: From an Ideal Drifter to Geostrophic Balance
AI辅助整理:OpenAI Codex|本节的解释、中文改写、英文翻译或网页编排含AI生成内容;引用资料及用户原始材料不因此变为AI生成。AI assistance: OpenAI Codex. Explanations, rewriting, English translation or layout include AI-generated work; cited and supplied source materials retain their own provenance.
本节整理科氏力、离心力、理想漂流模型、地转流及近惯性观测。动图是理想模型;后面的地图使用真实观测处理产品,两者用途不同。This section covers Coriolis and centrifugal effects, ideal drifters, geostrophic balance and near-inertial observations. The animation is an idealized model; the maps use processed observations.
1. 科氏力 / Coriolis force
在随地球旋转的参考系中,运动水团受到科氏加速度 aC = −2Ω × u。海洋大尺度水平运动常使用其水平近似 aC = −f k × u,其中 f = 2Ω sinφ,φ 为纬度,k 为竖直单位向量。科氏力与相对流速垂直,北半球使运动向右偏,南半球向左偏;它本身不对水团做功。In the Earth-rotating frame, a moving parcel experiences Coriolis acceleration aC = −2Ω × u. The usual horizontal approximation is aC = −f k × u, with f = 2Ω sinφ. It deflects motion to the right in the Northern Hemisphere and to the left in the Southern Hemisphere. Being perpendicular to velocity, it does no work on the parcel.
“向右偏”是相对于水团当前运动方向而言,不是固定向东或向西。f 在赤道为零、向两极绝对值增大;常规地转公式不能在赤道直接除以 f。Right or left is relative to the parcel’s direction of travel, not a fixed compass direction. The magnitude of f increases poleward and is zero at the equator, where the conventional geostrophic formulas cannot be used by division by f.
2. 离心力与向心加速度 / Centrifugal force and centripetal acceleration
地球自转参考系的离心加速度为 −Ω × (Ω × r),方向远离自转轴,即使水团相对地球静止也存在。它与引力合成有效重力,海洋方程中的 g 通常已包含这一背景影响,不能再重复加一次。Earth-frame centrifugal acceleration, −Ω × (Ω × r), points away from the rotation axis and exists even for a parcel at rest relative to Earth. Together with gravitational attraction it forms effective gravity; the usual oceanographic g already incorporates this background effect.
弯曲流线的向心加速度大小为 U²/R,指向曲率中心。若在随流弯曲的参考系描述,也会引入向外的离心惯性项,但不能与地球自转的离心项混淆。曲率效应不可忽略时,应考虑梯度流平衡,而不能只用最简单的地转平衡。Centripetal acceleration of a curved trajectory has magnitude U²/R and points toward the curvature centre. An outward centrifugal term may be introduced in a frame following that curved motion; it is distinct from Earth’s background centrifugal acceleration. Significant curvature requires gradient-wind/current balance rather than the simplest geostrophic balance.
3. 漂流瓶假设:理想水团与真实浮标 / Ideal drifter assumptions
这里将“漂流瓶假设”用作教学中的理想示踪粒子模型,并非一个统一的标准定律:瓶子足够小、完全随周围水流运动,忽略自身惯性、直接风拖曳、波浪漂移和与水体的滑移。于是 dx/dt = u,dy/dt = v,轨迹用来表示局地水团运动。Here “drifting-bottle assumption” means an ideal passive-tracer model, not a universally named law: a small tracer follows the surrounding water exactly, neglecting its own inertia, direct wind drag, wave drift and slip relative to water. Thus dx/dt = u and dy/dt = v describe its path.
真实漂流瓶露出水面的部分会受风,轨迹也可能包含波浪斯托克斯漂移;带水帆浮标能减少风滑移,但仍需质量控制。因此“漂流瓶路径”等于“地转流路径”通常不成立。真实轨迹可叠加地转流、风生流、潮流和近惯性运动。Real bottles can be directly wind-driven and affected by wave-induced Stokes drift. Drogued drifters reduce wind slip but still require quality control. A drifter track is not automatically a geostrophic streamline: geostrophic, wind-driven, tidal and near-inertial components may all contribute.
4. 无压强梯度时:惯性振荡 / With no pressure gradient: inertial oscillations
在水平无压强梯度、无摩擦、无持续风应力,且 f 为常数的理想情形,运动方程为 du/dt = fv、dv/dt = −fu。水团保持恒定速率,速度方向不断旋转:北半球顺时针、南半球逆时针。周期 T = 2π/|f|,半径 R = U/|f|;45°纬度的周期约为 16.9 小时。With no horizontal pressure gradient, friction or continuing wind stress, and constant f, du/dt = fv and dv/dt = −fu. Speed stays constant while velocity rotates clockwise in the Northern Hemisphere and anticlockwise in the Southern Hemisphere. The period is T = 2π/|f| and radius R = U/|f|; at 45° latitude the period is about 16.9 hours.
这是惯性运动,不是地转平衡。真实海洋的近惯性运动可与背景流叠加并以内部波形式传播,轨迹未必是闭合圆。This is inertial motion, not geostrophic balance. In the real ocean, near-inertial motions combine with background currents and can propagate as internal waves; trajectories need not form closed circles.
5. 有压强梯度时:地转平衡 / With a pressure gradient: geostrophic balance
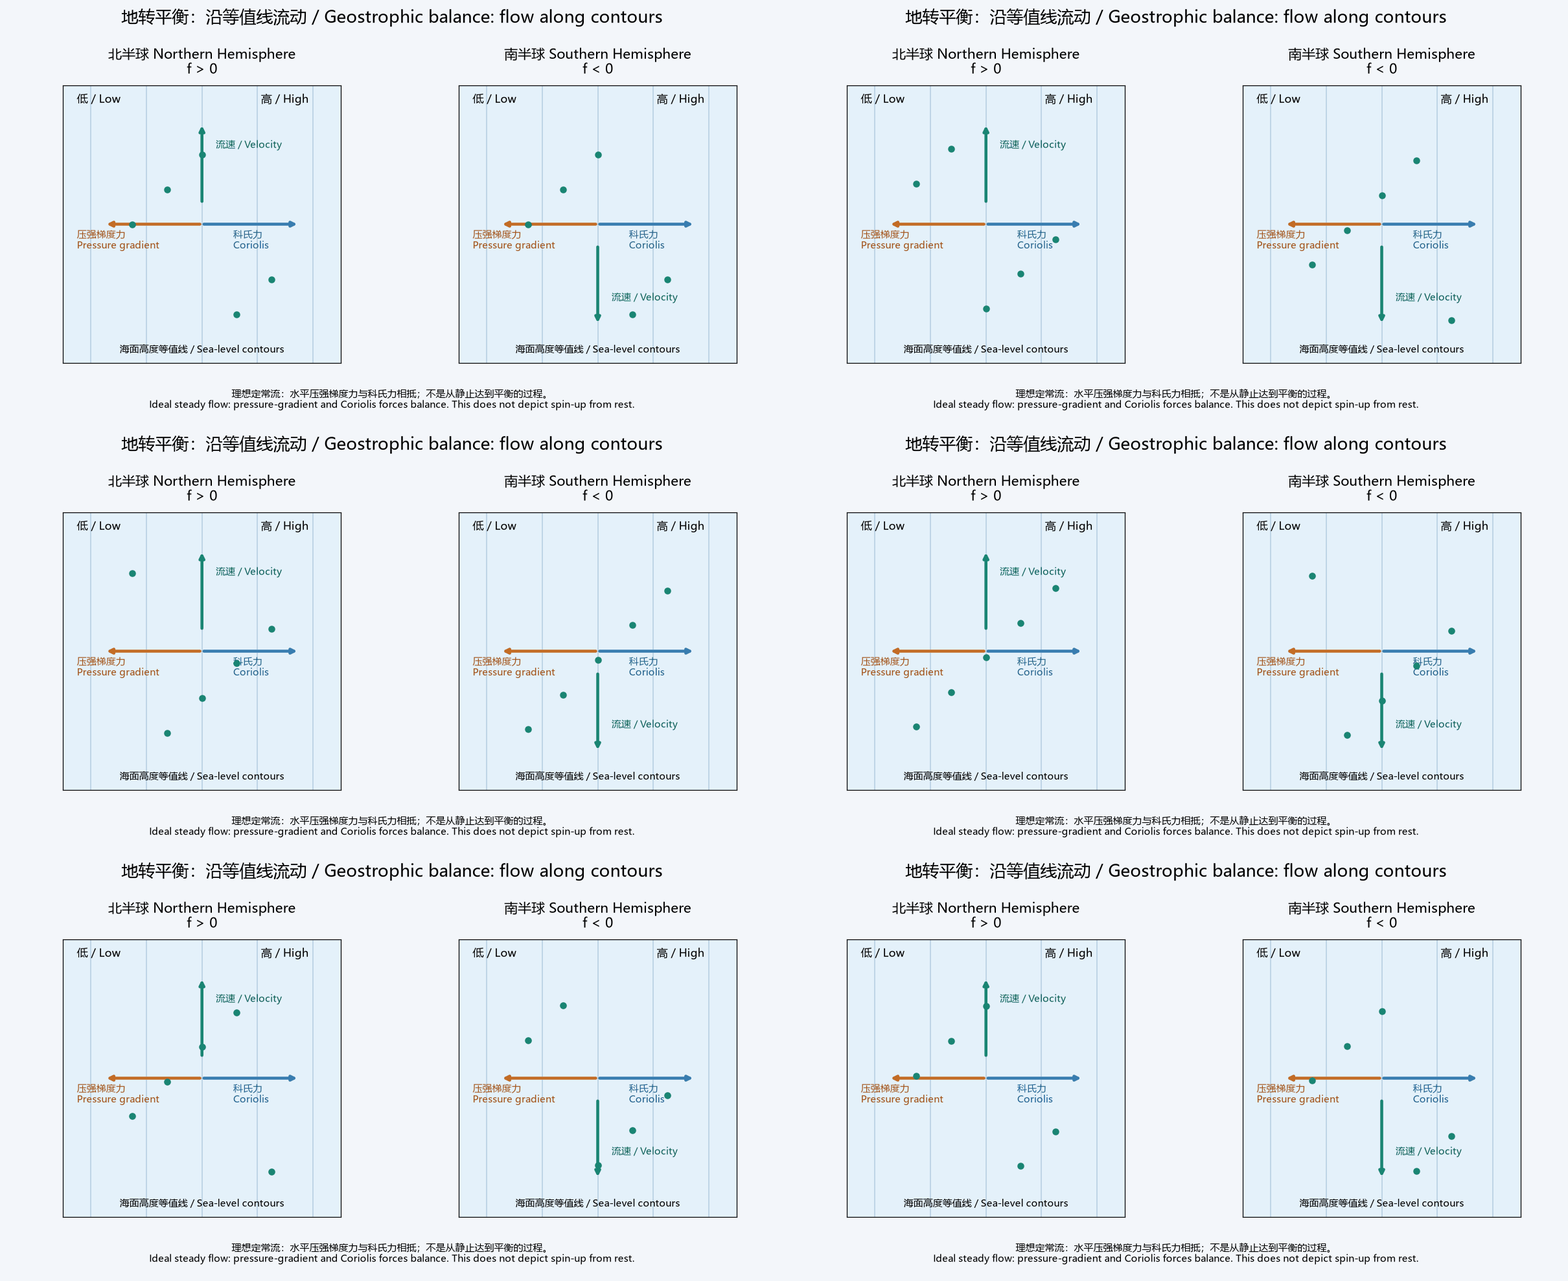
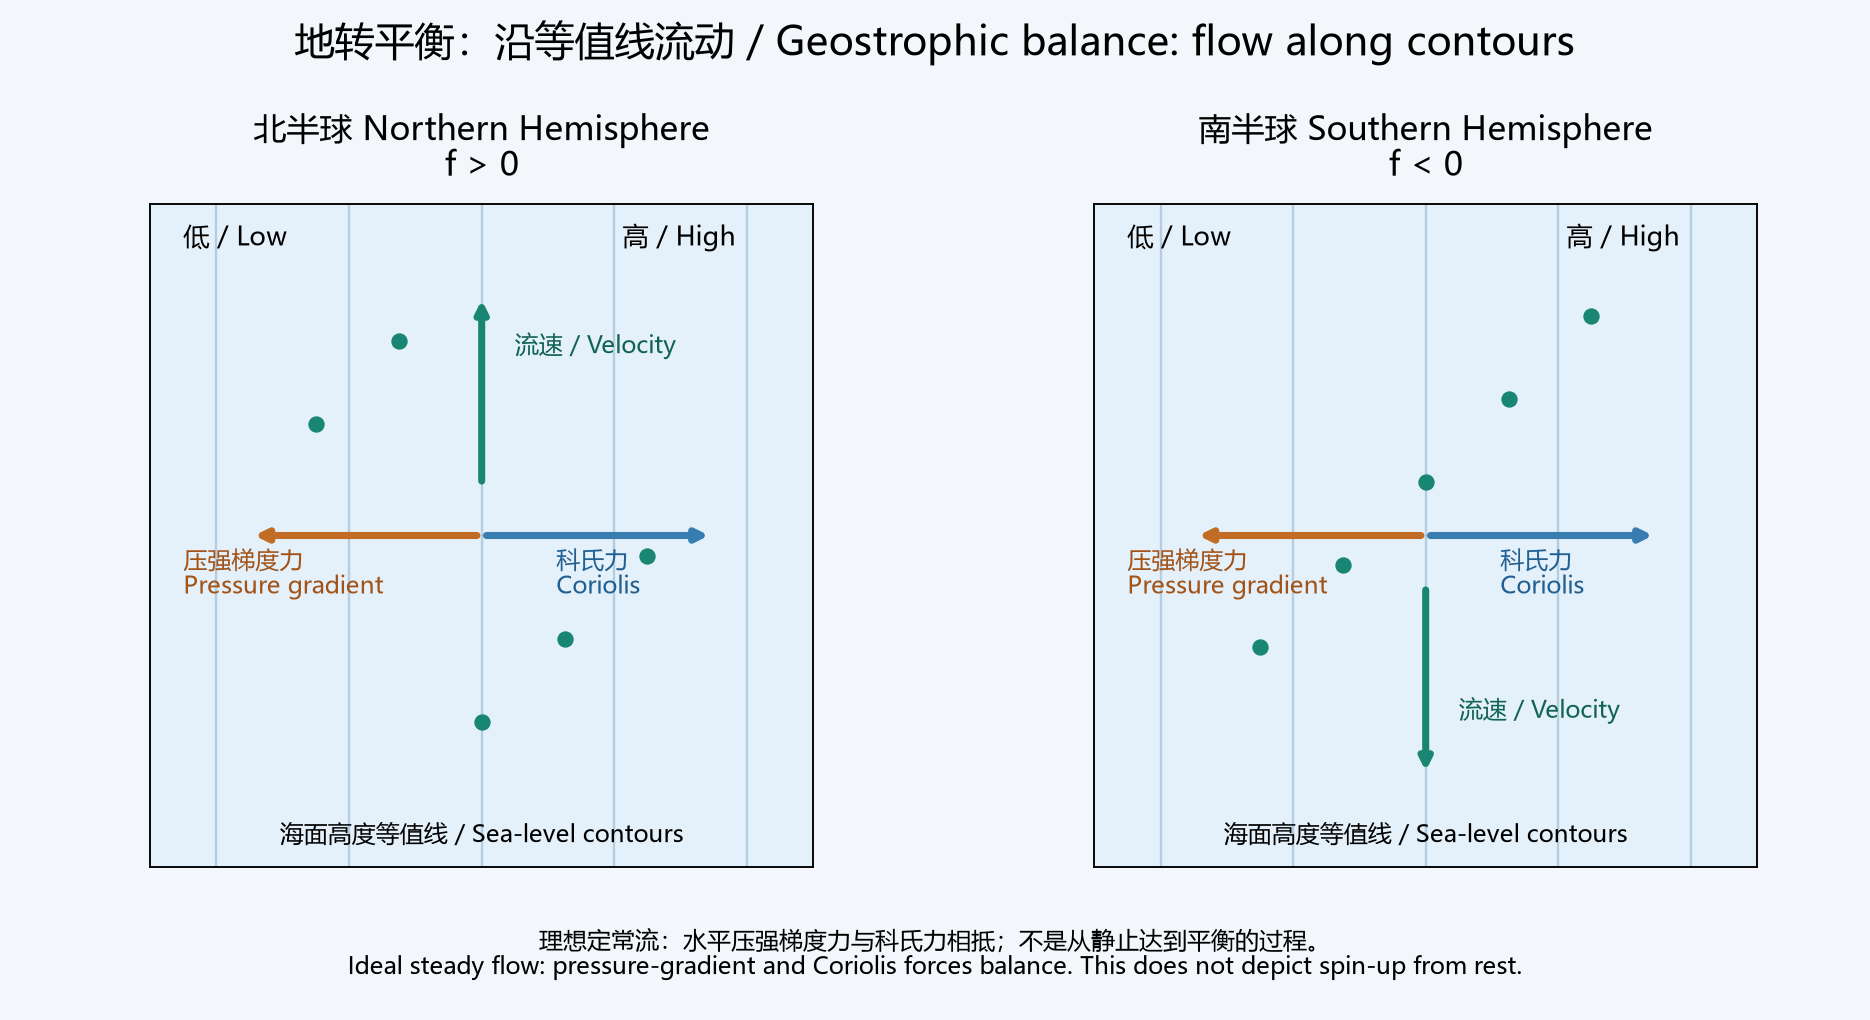
大尺度、缓慢变化、远离赤道且摩擦较弱的流动,水平压强梯度力可近似与科氏力抵消。此时流速沿等压线方向,而不是直接从高压流向低压。小罗斯贝数 Ro = U/(|f|L) ≪ 1 是常用适用条件之一;边界层、强曲率涡旋和快速变化过程可能偏离地转近似。For large-scale, slowly varying flow away from the equator with weak friction, the horizontal pressure-gradient and Coriolis forces can approximately balance. Flow is along isobars rather than directly from high to low pressure. A small Rossby number, Ro = U/(|f|L) ≪ 1, supports the approximation; boundary layers, strongly curved eddies and rapid transients can depart from it.
f k × ug = −∇h p / ρ
在 x 向东、y 向北,海面高度为 η 的简化情形下:With x eastward, y northward and sea-surface height η, the simplified surface expressions are:
ug = −(g/f) ∂η/∂y ; vg = (g/f) ∂η/∂x
北半球沿流向看,高海面在右侧;南半球则在左侧。这些是海面坡度对应的表面地转流关系;海洋内部密度水平差异也能产生随深度变化的压强梯度与地转流。Looking downstream, high sea level lies on the right in the Northern Hemisphere and on the left in the Southern Hemisphere. These formulas relate surface slope to surface geostrophic flow; internal horizontal density differences also generate depth-dependent pressure gradients and geostrophic currents.
6. 地转流动图 / Animated geostrophic balance
示意图制作:OpenAI Codex辅助编写Python绘图代码,使用Matplotlib渲染;为教学模型或示意,不是真实观测。OpenAI Codex assisted with Python/Matplotlib code. This is a teaching model or illustration, not an observation.
两图均为东侧海面高、西侧低,压强梯度力向西。北半球向北流、南半球向南流,使科氏力都向东与其抵消。绿点是理想示踪粒子;箭头表示方向,不共用力与速度的量纲比例。这是已建立平衡的定常流,不是无摩擦水团从静止自动达到平衡的模拟。Both panels have higher sea level to the east and a westward pressure-gradient force. Northward flow in the Northern Hemisphere and southward flow in the Southern Hemisphere each produce an eastward Coriolis force. Green dots are ideal tracers. Arrows show directions, not a shared force/velocity scale. The flow is already balanced; this is not frictionless spin-up from rest.
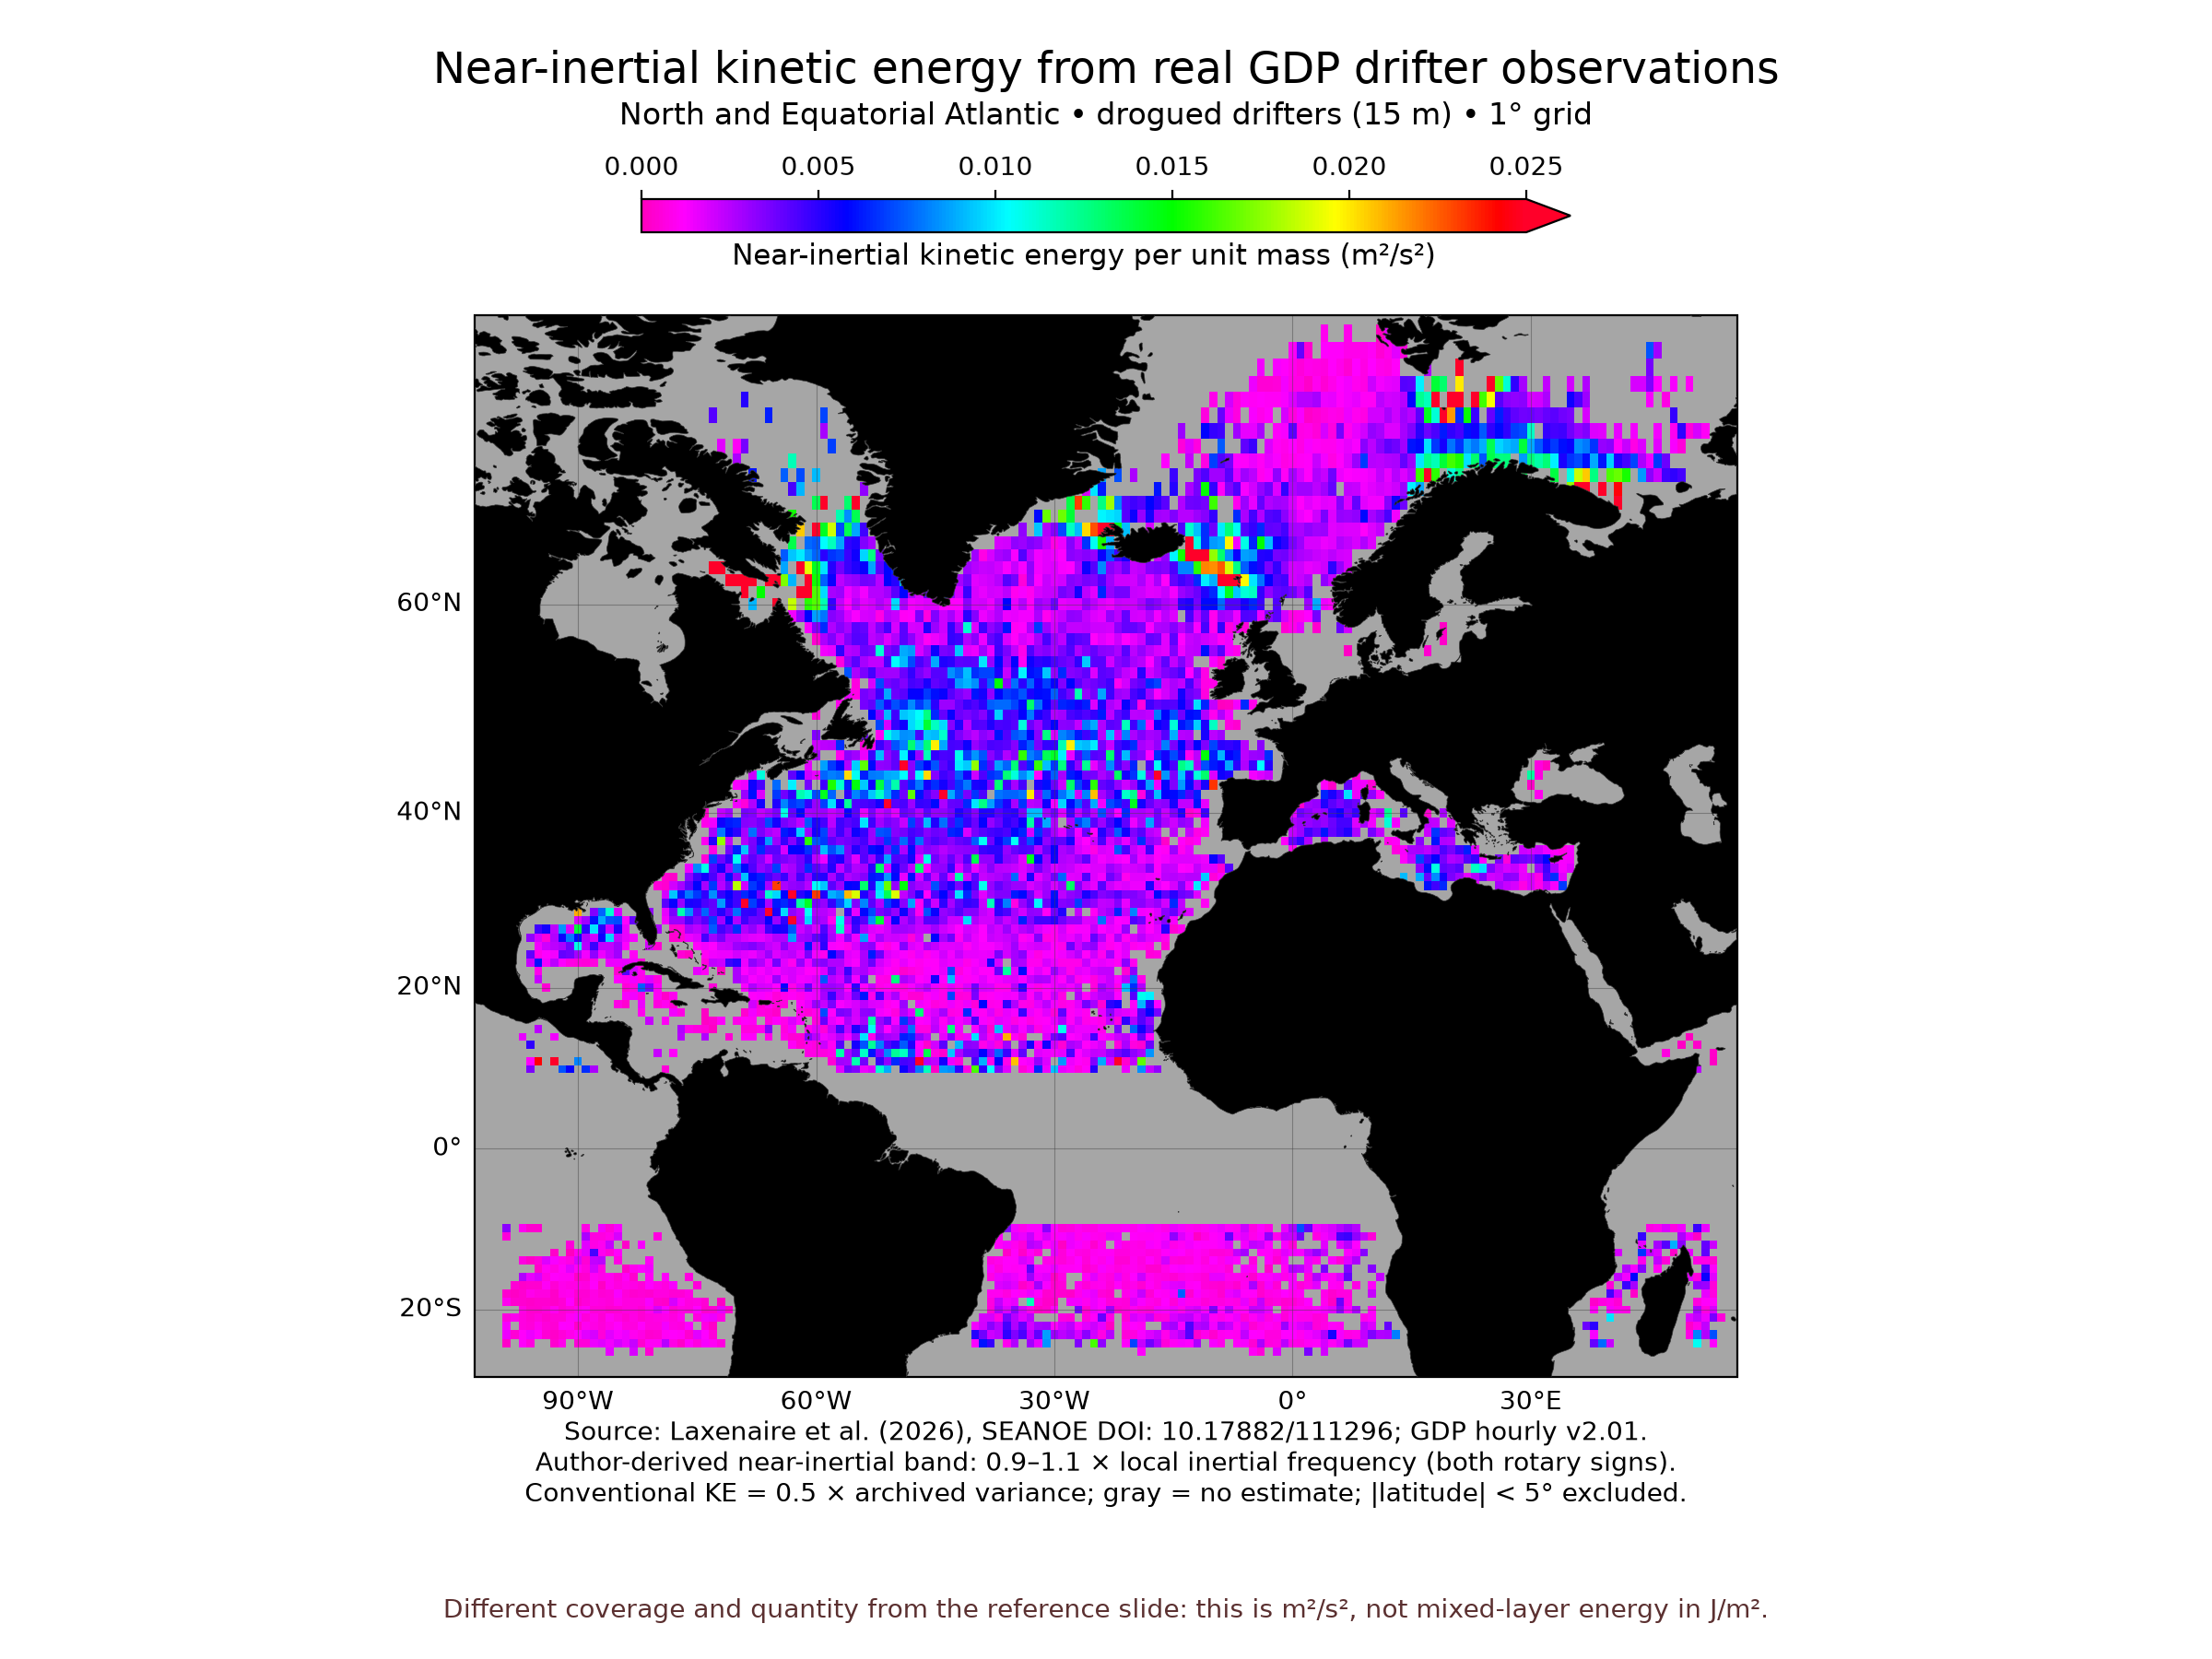
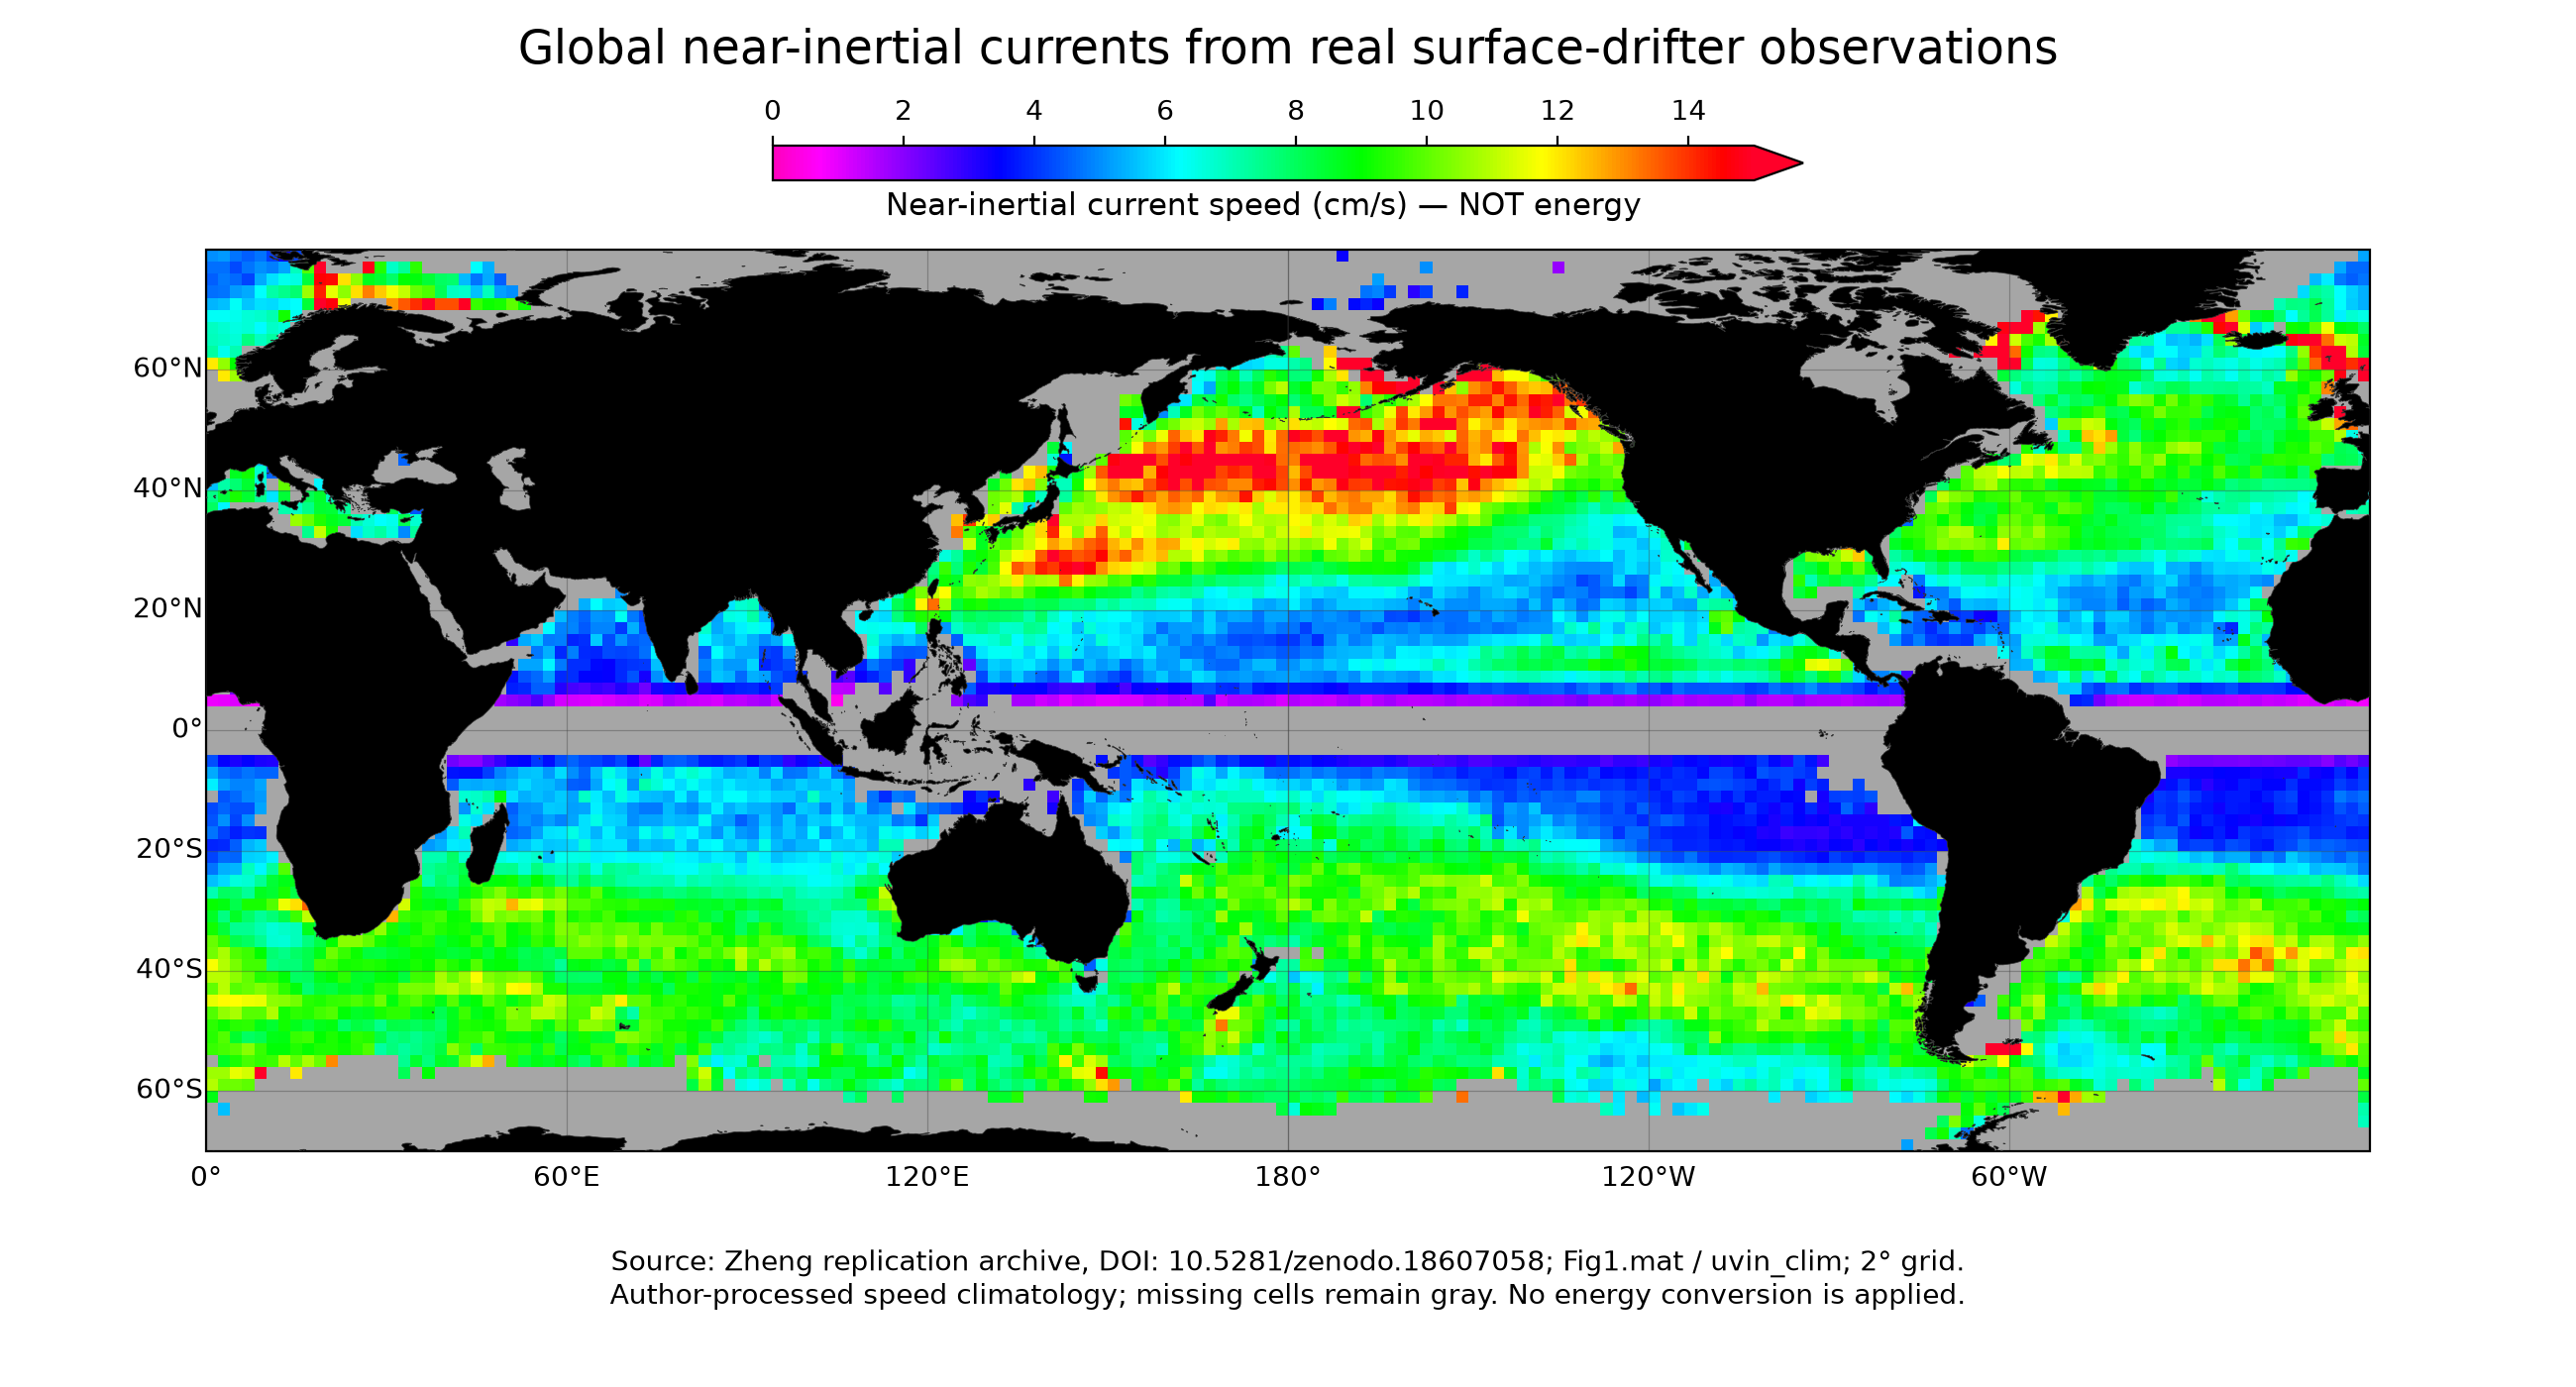
以下是近惯性运动图,不能作为地转流能量图。只重绘作者公开的处理产品,没有独立重跑原始浮标轨迹的全部分析,也没有使用模拟数据填补观测缺测。These maps describe near-inertial motion, not geostrophic-current energy. They replot public author-processed products; the full raw-trajectory analyses were not independently rerun, and missing observations were not filled with synthetic data.
图表制作:OpenAI Codex辅助编写Python代码,使用Matplotlib与Cartopy重绘公开观测处理产品;数据来源见原图说明,不是AI合成观测。OpenAI Codex assisted with Python plotting code using Matplotlib and Cartopy. Public observational products were replotted, not synthesized.
北大西洋及赤道大西洋区域产品,1°网格、有15米水帆的GDP浮标。源变量省略了动能定义中的1/2,本图乘0.5后采用 m²/s²(J/kg)。赤道±5°以内排除,灰色为无估计值;色标上限之外使用延伸色。North and Equatorial Atlantic product, on a 1° grid, from GDP drifters with 15 m drogues. The source omits the kinetic-energy factor 1/2; multiplication by 0.5 gives conventional KE in m²/s² (J/kg). The equatorial ±5° band is excluded. Gray indicates no estimate; values above the color limit use the extension color.
图表制作:OpenAI Codex辅助编写Python代码,使用Matplotlib与Cartopy重绘公开观测处理产品;数据来源见原图说明,不是AI合成观测。OpenAI Codex assisted with Python plotting code using Matplotlib and Cartopy. Public observational products were replotted, not synthesized.
全球近惯性流速气候态,2°网格,单位 cm/s。它是流速图,不是动能图;不能将平均流速的平方当成平均动能。Global near-inertial speed climatology, on a 2° grid, in cm/s. This is a speed map, not an energy map; squared mean speed is not mean kinetic energy.
与最初参考图的区别:参考图是全球混合层面积能量 J/m²;这里分别是区域单位质量动能与全球流速,不能直接比较颜色值。若假设混合层内近惯性流垂向均匀,可用 Earea = ρh KE 转成面积能量,但还需匹配密度、混合层厚度及取样条件;这里未任意指定 h。The reference slide shows global mixed-layer energy per area (J/m²); these products show regional energy per mass and global speed. Their color values are not directly comparable. Under a vertically uniform mixed-layer assumption, Earea = ρh KE, but matching density, layer depth and sampling are required. No arbitrary h was imposed here.
8. 与热通量的关系 / Connection to heat fluxes
表面加热、冷却改变海水密度和混合层深度,进而影响层结、水平压强梯度及地转流的垂向切变;风应力可以激发近惯性运动,相关剪切和混合又会影响海温。风应力不是热通量,科氏力也不是热源。单位为 J/m² 的能量与 W/m² 的热通量并不是同一物理量。Surface heating and cooling alter density, mixed-layer depth and stratification, affecting horizontal pressure gradients and vertical geostrophic shear. Wind stress can excite near-inertial motion; associated shear and mixing can in turn affect temperature. Wind stress is not heat flux, and Coriolis force is not a heat source. Energy in J/m² differs from heat flux in W/m².
9. 湾流剖面图:怎样判断流向?9. Gulf Stream section: how do we determine the flow direction?
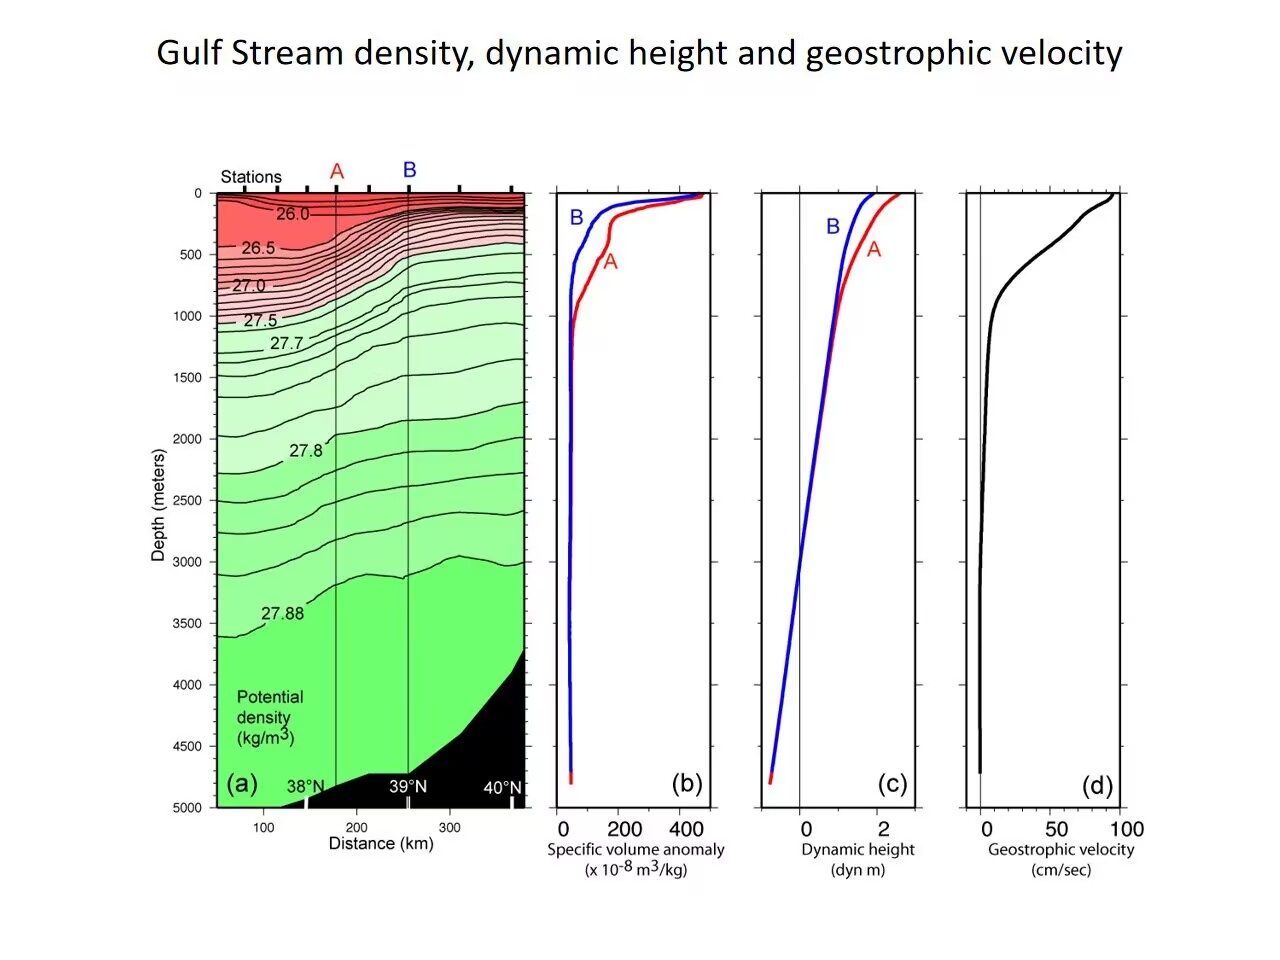
图片来源:用户提供的课堂资料;本页解释与翻译由OpenAI Codex辅助整理,原图未由本助手生成。Image supplied by the user. OpenAI Codex assisted with interpretation and translation; the original image was not generated by this assistant.
用户提供的课堂参考图;以下方向判断依据图中从左到右纬度增大,以及北半球地转平衡。Classroom reference image supplied by the user. The interpretation uses increasing latitude from left to right and Northern Hemisphere geostrophic balance.
先看剖面方向:图(a)横轴从左侧约38°N到右侧40°N,因此左侧偏南、右侧偏北;A在B的南侧。图是跨越湾流的垂直剖面,流速主要垂直于剖面,不能把右侧速度曲线误读为水沿剖面向右流。First establish the section orientation: panel (a) runs from roughly 38°N on the left to 40°N on the right, so A is south of B. This is a cross-stream vertical section. The current is primarily normal to the section; the rightward velocity curve does not mean water flows rightward along the section.
图(a)、(b):上层A侧同一深度的海水较轻,比容异常较大;B侧较密,比容异常较小。等密度线向北(向右)抬升,显示明显的水平密度差。图中26—27.88这样的标值应理解为位密度异常,不能当成海水实际密度只有约27 kg/m³。Panels (a) and (b): in the upper ocean, A has lighter water and a larger specific-volume anomaly than B at the same depth. Isopycnals rise northward (to the right), indicating a horizontal density contrast. Labels such as 26–27.88 represent potential-density anomaly, not an actual seawater density of about 27 kg/m³.
图(c):在相同参考压力下向上积分比容异常,A上层的动力高度高于B。因此上层动力高度由南向北减小,对应向北的水平压强梯度力。动力高度是由水文剖面积分得到的量,并不直接等于卫星测得的海面高度。Panel (c): integrating specific-volume anomaly upward from a common reference pressure gives greater upper-ocean dynamic height at A than at B. Dynamic height decreases northward, implying a northward pressure-gradient force in the upper ocean. Dynamic height is derived from hydrographic integration and is not simply satellite-measured sea-surface height.
流向结论:北半球f>0,取x向东、y向北,u_g=−(1/f)∂D/∂y,其中D为动力位势异常。由∂D/∂y<0得到u_g>0:在近似南北剖面下,流动向东。其右侧(南侧A)动力高度高,左侧(北侧B)低;向东流对应向南的科氏力,恰与向北的压强梯度力平衡。实际湾流在此区域常向东北流;精确方位需结合站位经纬度和剖面朝向,单凭这张图不能唯一确定东北偏角。Direction: in the Northern Hemisphere f>0. With x eastward and y northward, u_g=−(1/f)∂D/∂y, where D is dynamic geopotential anomaly. Since ∂D/∂y<0, u_g>0: an approximately north–south section implies eastward flow. Higher dynamic height lies on its right (south, A); the southward Coriolis force balances the northward pressure-gradient force. The actual Gulf Stream often flows northeastward here, but an exact bearing requires station coordinates and section orientation.
图(d):曲线显示上层流速最大,表层约90 cm/s,向深处明显减弱。这是从图上估读的数量级。水文资料首先给出相对于参考层的地转流;若未提供参考层的绝对流速,不能把整条曲线无条件称为绝对流速,也不能仅凭深层接近零断言深海完全静止。Panel (d): speed is strongest near the surface, approximately 90 cm/s by visual reading, and weakens with depth. Hydrography initially provides geostrophic velocity relative to a reference level. Without its absolute velocity, the profile cannot unconditionally be treated as absolute flow, and a near-zero deep value does not prove that the deep ocean is motionless.
10. 艾克曼输运:解释动画10. Ekman transport: an animated explanation
从风应力向海洋输入动量开始,观看艾克曼螺旋、南北半球的净输运方向,以及离岸输运引起的上升流。视频约63秒,含中英文屏幕说明,无配音。Follow momentum transfer from the wind, the Ekman spiral, net transport in both hemispheres, and coastal upwelling driven by offshore transport. The video lasts about 63 seconds, with bilingual on-screen explanations and no narration.
艾克曼理论:从风到海流Ekman theory: from wind to ocean currents
1. 风、湍流与科氏作用1. Wind, turbulence and rotation
风通过风应力输入动量,湍流应力把动量向下传递。在理想定常状态下,艾克曼流的科氏力与湍流应力产生的力平衡;地转流则主要由科氏力与水平压强梯度力平衡。艾克曼流是风生的非地转分量,不代表全部海流。Wind stress supplies momentum, and turbulent stress transfers it downward. In ideal steady Ekman flow, the Coriolis force balances the force due to turbulent stress. Geostrophic flow instead balances Coriolis and horizontal pressure-gradient forces. The Ekman component is not the total ocean current.
2. 艾克曼螺旋与45°2. The Ekman spiral and 45°
经典定常、深水、水平均匀、恒定涡黏性模型中,表层流相对风应力偏转45°:北半球向右,南半球向左。随深度增加,流速指数衰减;从上往下比较,北半球流向顺时针旋转,南半球逆时针旋转。“螺旋”描述不同深度的速度,不是水粒子螺旋下沉;真实表层偏角不一定是45°。For the classical steady, deep, horizontally uniform, constant-viscosity solution, surface flow lies 45° right of wind stress in the Northern Hemisphere and left in the Southern Hemisphere. Speed decays exponentially with depth, while direction turns clockwise with increasing depth in the north and anticlockwise in the south. This describes a velocity profile, not a sinking spiral trajectory. Real surface angles can differ.
3. 净输运与90°3. Net transport and 90°
把艾克曼流速度从层底积分到海面,得到每单位宽度的体积输运M,单位m²/s。北半球净输运向风应力右侧90°,南半球向左侧90°。45°是经典表层流的角度,90°是整层积分后的方向,不能混淆。Integrating Ekman velocity from the base to the surface gives volume transport per unit width, M, in m²/s. Net transport is 90° right of wind stress in the Northern Hemisphere and left in the Southern Hemisphere. The classical 45° surface angle and the 90° integrated transport angle describe different quantities.
Mₓ = τᵧ/(ρf),Mᵧ = −τₓ/(ρf);M = ∫ u_E dz。x points east, y north; τ is surface wind stress, ρ is density, f is the signed Coriolis parameter, and u_E is Ekman velocity.
例如风向北吹:北半球经典表层流向东北,净输运向东;南半球经典表层流向西北,净输运向西。For northward wind: classical surface flow is northeastward and net transport eastward in the Northern Hemisphere; surface flow is northwestward and net transport westward in the Southern Hemisphere.
4. 沿岸上升流的方向判断4. Determining coastal upwelling
北半球、陆地在东侧而海洋在西侧时,沿岸向南的风产生向西的净输运,使表层水离岸,较深处的水上升补充。风反向时可能造成向岸输运与下沉。因此并非所有沿岸风都导致上升流;必须一起判断半球、风向和海岸方位。In the Northern Hemisphere, with land to the east and ocean to the west, southward alongshore wind drives westward offshore transport. Deeper water rises to replace the exported surface water. Reversing the wind can drive onshore transport and downwelling. Hemisphere, wind direction and coastline orientation must all be specified.
5. 适用条件与动画阅读提示5. Assumptions and how to read the animation
90°输运关系要求适用的定常艾克曼平衡、非零科氏参数以及可忽略的层底应力;它本身不要求涡黏性恒定。恒定涡黏性用于经典螺旋解析解。浅水、瞬变、赤道附近和强锋面需额外分析。视频开头的同向箭头只示意动量传递,不表示稳态海流方向;视频中的输运应理解为艾克曼分量的积分。The 90° relation requires the applicable steady Ekman balance, nonzero Coriolis parameter and negligible stress at the base; constant viscosity is not itself required. Constant viscosity yields the classical spiral solution. Shallow water, transients, equatorial and strong-frontal conditions need additional analysis. The opening parallel arrows only illustrate momentum transfer, not steady current direction; video transport refers to the Ekman component.
动画制作:OpenAI Codex生成及修改Python脚本,Manim Community渲染。中英双语屏幕文字由Codex辅助撰写;无配音,内容为理想化教学示意。Animation: Python scripts generated and revised with OpenAI Codex, rendered with Manim Community. Bilingual text was AI-assisted. Idealized teaching illustration, without narration.
区分表层流和整层输运:经典定常、深水、恒定涡黏性模型中的表层流偏转约45°;净输运在北半球位于风应力右侧90°,南半球位于左侧90°。真实表层偏角会变化。动画中不同方向的箭头代表不同深度的速度,不是单个粒子的螺旋轨迹。Distinguish surface velocity from depth-integrated transport: the classical steady, deep-water, constant-viscosity model gives a surface angle of about 45°. Net transport lies 90° to the right of wind stress in the Northern Hemisphere and to the left in the Southern Hemisphere. Real surface angles vary. The rotating arrows represent velocities at different depths, not a single particle's spiral trajectory.
AI辅助整理:OpenAI Codex|本节的解释、中文改写、英文翻译或网页编排含AI生成内容;引用资料及用户原始材料不因此变为AI生成。AI assistance: OpenAI Codex. Explanations, rewriting, English translation or layout include AI-generated work; cited and supplied source materials retain their own provenance.
相对涡度与位势涡度Relative and potential vorticity
相对涡度描述局地自转而非平移。取东为x、北为y,ζ=∂v/∂x−∂u/∂y;从上方看逆时针为正。单层浅水模型中q=(f+ζ)/H;无摩擦、无非绝热过程等理想条件下,随水团运动的位涡守恒。压短水柱可改变自身涡度,也可通过纬向位置变化改变f。Relative vorticity measures local rotation rather than translation. With x east and y north, counterclockwise rotation is positive. In an ideal shallow-water layer, material potential vorticity is conserved under inviscid, adiabatic conditions. Compression can change relative vorticity or be accompanied by a change in latitude.
ζ = ∂v/∂x − ∂u/∂y; q = (f + ζ)/H
Sverdrup平衡Sverdrup balance
海盆内部的大尺度定常近似,把行星涡度平流与风应力旋度联系起来。V是包括表层艾克曼分量的深度积分经向输运,向北为正,单位m²/s。北半球副热带典型负风应力旋度对应向南输运;西边界回流需额外动力学。艾克曼层下方水柱压短、相对涡度贡献较小时,趋向赤道;拉长则趋向极地。In a large-scale steady interior balance, planetary-vorticity advection balances wind-stress curl. V is depth-integrated northward transport, including the surface Ekman component, in m²/s. Typical negative subtropical wind-stress curl gives southward interior transport in the Northern Hemisphere. Western boundary return flow requires additional dynamics. When relative-vorticity contributions are small, compression below the Ekman layer favors equatorward motion and stretching favors poleward motion.
βV = (∂τ_y/∂x − ∂τ_x/∂y)/ρ₀
β效应The beta effect
f=2Ωsinφ随纬度变化;β=∂f/∂y。在局地β平面上可写f≈f₀+βy。水团南北移动会改变行星涡度;这种变化参与罗斯贝波的恢复机制,也参与西边界强化,但边界流仍需要摩擦或非线性过程闭合涡度收支。The Coriolis parameter varies with latitude. On a local beta plane, f≈f₀+βy. Meridional displacement changes planetary vorticity, contributing to Rossby-wave dynamics and western intensification; frictional or nonlinear processes are still required in boundary-current vorticity budgets.
AI辅助整理:OpenAI Codex|本节的解释、中文改写、英文翻译或网页编排含AI生成内容;引用资料及用户原始材料不因此变为AI生成。AI assistance: OpenAI Codex. Explanations, rewriting, English translation or layout include AI-generated work; cited and supplied source materials retain their own provenance.
这里讨论线性表面重力波,忽略表面张力、旋转与背景流。相速度C是波峰移动速度;群速度Cg描述波包与能量传播,两者不能混用。These are linear surface gravity waves without surface tension, rotation or mean flow. Phase speed C tracks crests; group speed Cg describes wave packets and energy propagation.
符号:k=2π/L,ω=2π/T;L为波长,T为周期,h为水深。完整关系为ω²=gk tanh(kh),C=ω/k=√[(g/k)tanh(kh)]。Definitions: k=2π/L, ω=2π/T; L is wavelength, T period and h depth. Dispersion: ω²=gk tanh(kh); C=ω/k=√[(g/k)tanh(kh)].
深水条件通常取h>L/2:tanh(kh)≈1,所以C≈√(g/k)=√(gL/2π)。波速近似不依赖水深,波长越长速度越快,因此频散。For deep water, commonly h>L/2, tanh(kh)≈1. Thus C≈√(g/k)=√(gL/2π): longer waves travel faster, with little depth dependence.
浅水条件通常取h<L/20:tanh(kh)≈kh,所以C≈√(gh)。同一水深下,波速近似不依赖波长,因此在该理想极限中无频散。深浅是相对波长而言,几千米深的大洋也可能满足海啸的浅水条件。For shallow water, commonly h<L/20, tanh(kh)≈kh and C≈√(gh). At fixed depth the ideal limit is nondispersive. Depth is relative to wavelength; even a deep ocean may be shallow for a tsunami.
风暴生成不同周期的波。离开主要风区后,不同成分按传播速度逐渐分离,远处的涌浪往往较规则。讨论到达顺序应使用群速度:Cg=dω/dk;深水重力波Cg=C/2=gT/(4π),长周期波群通常先到。Storms generate many periods. After leaving the forcing region, components separate by speed, producing more regular distant swell. Arrival times use group speed: Cg=dω/dk; for deep-water gravity waves Cg=C/2=gT/(4π), so longer-period groups generally arrive first.
有限水深下Cg=(C/2)[1+2kh/sinh(2kh)];浅水极限Cg≈C。第一张课件的“长波”指相对水深很长,第二张说“长波更快”是在深水重力波之间比较,不能推广到所有波。At finite depth Cg=(C/2)[1+2kh/sinh(2kh)], approaching C in shallow water. “Long wave” in the first slide is relative to depth; the second compares wavelengths in deep-water gravity waves, not every wave type.
海洋波动:七道思考题Ocean Waves: Seven Review Questions
AI辅助整理:OpenAI Codex|本节的解释、中文改写、英文翻译或网页编排含AI生成内容;引用资料及用户原始材料不因此变为AI生成。AI assistance: OpenAI Codex. Explanations, rewriting, English translation or layout include AI-generated work; cited and supplied source materials retain their own provenance.
1. 何时可以忽略科氏力?1. When can rotation be neglected?
当ω≫|f|,即周期T远小于当地惯性周期2π/|f|时,单个周期内旋转影响较小。普通秒级风浪通常满足;不能仅由水深判断。Rotation is small over a cycle when ω≫|f|, or T≪2π/|f|. Ordinary wind waves usually satisfy this; depth alone is not the criterion.
2. 哪些波有频散?2. Which waves are dispersive?
频散看相速度是否随波数变化。表面重力波ω²=gK tanh(Kh),一般频散,浅水极限无频散;旋转浅水惯性重力波ω²=f²+c²K²,一般频散,高频极限近似无频散;经典无背景流罗斯贝波ω=−βk/(k²+l²+Rd⁻²),一般频散,理想长波极限可近似无频散。K=√(k²+l²),c为对应模态波速;这些公式属于不同模型。Dispersion means phase speed varies with wavenumber. Surface gravity waves obey ω²=gK tanh(Kh), with a nondispersive shallow limit. Rotating shallow-water inertia–gravity waves obey ω²=f²+c²K² and are generally dispersive. Classical Rossby waves obey ω=−βk/(k²+l²+Rd⁻²), with a nondispersive ideal long-wave limit. K=√(k²+l²); these formulas apply to different models.
3. 赤道波导怎样形成?3. Why is the equator a waveguide?
赤道附近f≈βy,跨赤道变号,旋转背景的空间变化使某些模态局限在赤道附近。主要包括向东的开尔文波、经典相位向西的罗斯贝波、混合罗斯贝—重力波(Yanai波),以及向东或向西的惯性重力波分支。Near the equator f≈βy changes sign, trapping certain modes near the equator. Modes include eastward Kelvin waves, westward-phase Rossby waves, mixed Rossby–gravity (Yanai) waves, and eastward and westward inertia–gravity branches.
4. 陆架长波有哪些?4. What are shelf and coastal long waves?
常讨论沿岸开尔文波、地形罗斯贝/大陆架波,以及分层沿岸俘获波。它们分别或共同受海岸、地形、层结和旋转约束。理想常规地形与无背景流下,低频俘获波通常沿浅水在右(北半球)、左(南半球)的方向传播;不同模态的频散与能量方向需具体判断。Common types are coastal Kelvin waves, topographic Rossby or shelf waves, and stratified coastal-trapped waves. Coastlines, topography, stratification and rotation constrain them. Under standard ideal conditions, shallow water is typically on the right in the Northern Hemisphere and left in the Southern; modal dispersion and energy propagation need separate analysis.
5. 海湾静振与重力波有何异同?5. How does a seiche relate to gravity waves?
表面静振通常就是受边界约束的重力驻波:有较固定的波节和波腹,而行进波的波峰前进。理想均匀深度水盆的基频周期:两端封闭T₁≈2L/√(gh);一端封闭、一端理想开口T₁≈4L/√(gh)。实际几何与开口会改变周期。A surface seiche is usually a bounded standing gravity wave, with fixed nodes and antinodes. For ideal uniform-depth basins, T₁≈2L/√(gh) for two closed ends and T₁≈4L/√(gh) for one closed and one ideal open end. Real geometry changes the periods.
6. 内波发生的基本条件?6. What allows internal waves?
需要稳定密度层结提供浮力恢复作用,并有扰动激发。Boussinesq近似下取z向上,N²=−(g/ρ₀)dρ̄/dz>0;真实海水需正确处理压缩性。局地稳定分层旋转流体中的自由内惯性重力波通常满足|f|<ω<N。Stable stratification provides buoyancy restoring forces and disturbances excite waves. With z upward in the Boussinesq approximation, N²=−(g/ρ₀)dρ̄/dz>0; seawater compressibility requires care. Freely propagating internal inertia–gravity waves typically satisfy |f|<ω<N.
7. 海啸如何产生,跨洋传播受旋转影响吗?7. How are tsunamis generated, and does rotation matter?
海底升降、滑坡或火山等造成快速、大范围水体位移,重力使扰动传播。长波海啸常满足C≈√(gh)。许多成分ω≫|f|,旋转对单周期影响较弱,但跨洋精确计算仍可需要保留科氏项;应结合周期、纬度、传播时间和精度判断,不能仅凭距离下结论。Rapid large-scale water displacement from seabed motion, landslides or volcanic activity generates gravity waves. Long tsunamis often have C≈√(gh). Many components have ω≫|f|, yet accurate transoceanic calculations may retain Coriolis terms. Importance depends on period, latitude, travel time and required accuracy.
AI辅助整理:OpenAI Codex|本节的解释、中文改写、英文翻译或网页编排含AI生成内容;引用资料及用户原始材料不因此变为AI生成。AI assistance: OpenAI Codex. Explanations, rewriting, English translation or layout include AI-generated work; cited and supplied source materials retain their own provenance.
故事会 · 海南近岸水色谜案Story Session · The Mystery of Coastal Ocean Color near Hainan
一分钟故事动画 / One-minute Story
约1分钟,中英双语屏幕文字,无配音。OpenAI Codex辅助编写脚本与文案,Manim渲染;卫星图取自用户PPT,来源沿用其标注,泥沙运动为教学示意。 / Bilingual on-screen text, no narration. OpenAI Codex-assisted script and text, rendered with Manim; satellite imagery from the supplied deck and sediment motion is schematic.
资料来源:作者提供的10页PPT。OpenAI Codex辅助提取、整理与英文翻译;图片与GIF取自原文件,未在本次任务重新生成。原图来源沿用PPT标注。Source: the supplied ten-slide deck. OpenAI Codex assisted with extraction, organization and English translation. Images and GIF were extracted, not generated in this task; source credits follow the deck.
故事主线:发现近岸水色变化 → 追踪风暴、河流出流与泥沙 → 判断光学来源 → 选择叶绿素反演方法。Storyline: observe coastal color changes → investigate storms, river outflows and sediment → identify optical contributions → select chlorophyll retrieval methods.
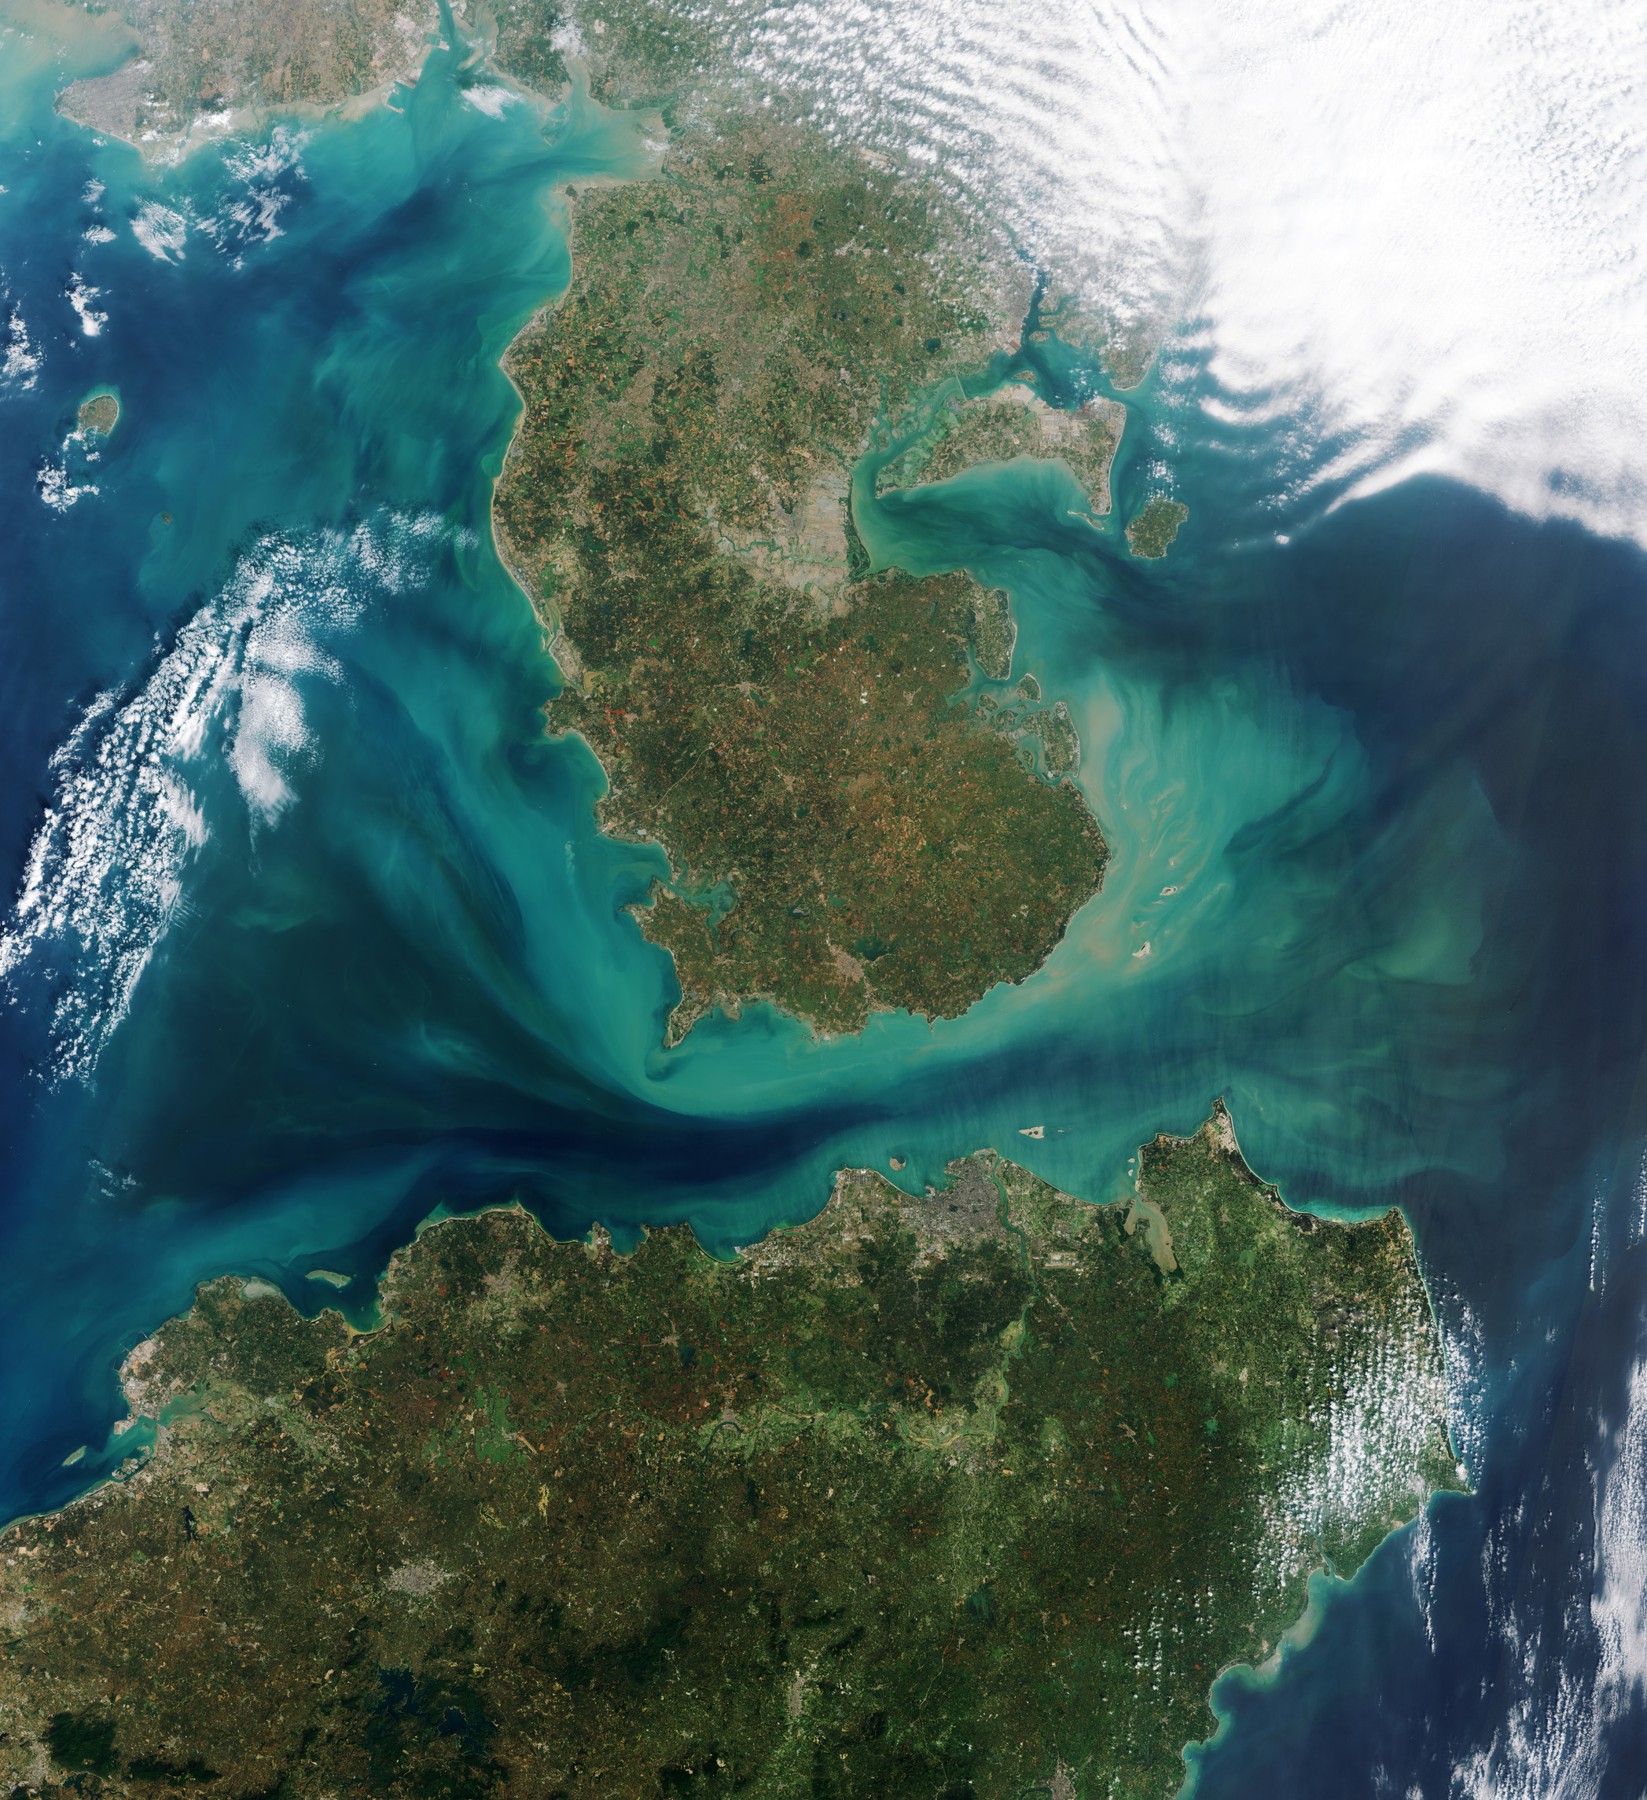
1. 现场:海南近岸为何变色?1. The scene: why does coastal water change color?
近岸水体可能呈绿色、黄褐色或条带状,并随降雨、风浪和海流变化。绿色不一定就是浮游植物增多:悬浮泥沙和有色溶解有机物也会改变信号。问题不是先判断“绿不绿”,而是追问“谁改变了水色”。Coastal waters can appear green, brown or banded as rainfall, waves and currents change. Green water alone does not establish a phytoplankton increase: suspended sediment and colored dissolved organic matter also affect the signal.
PPT标注来源:ESA,Earth from Space: Hainan Strait(2024)。Credit as supplied: ESA, Earth from Space: Hainan Strait (2024).
2. 三股力量共同作用2. Three interacting processes
风暴增强波浪与混合;河流带来淡水、泥沙、营养盐和有色物质;海底颗粒被重新卷起后又被海流搬运。三者相遇时,卫星看到的是混合后的结果。Storms strengthen waves and mixing; rivers supply freshwater, sediment, nutrients and colored material; resuspended seabed particles are transported by currents. Satellite color reflects their combined effects.
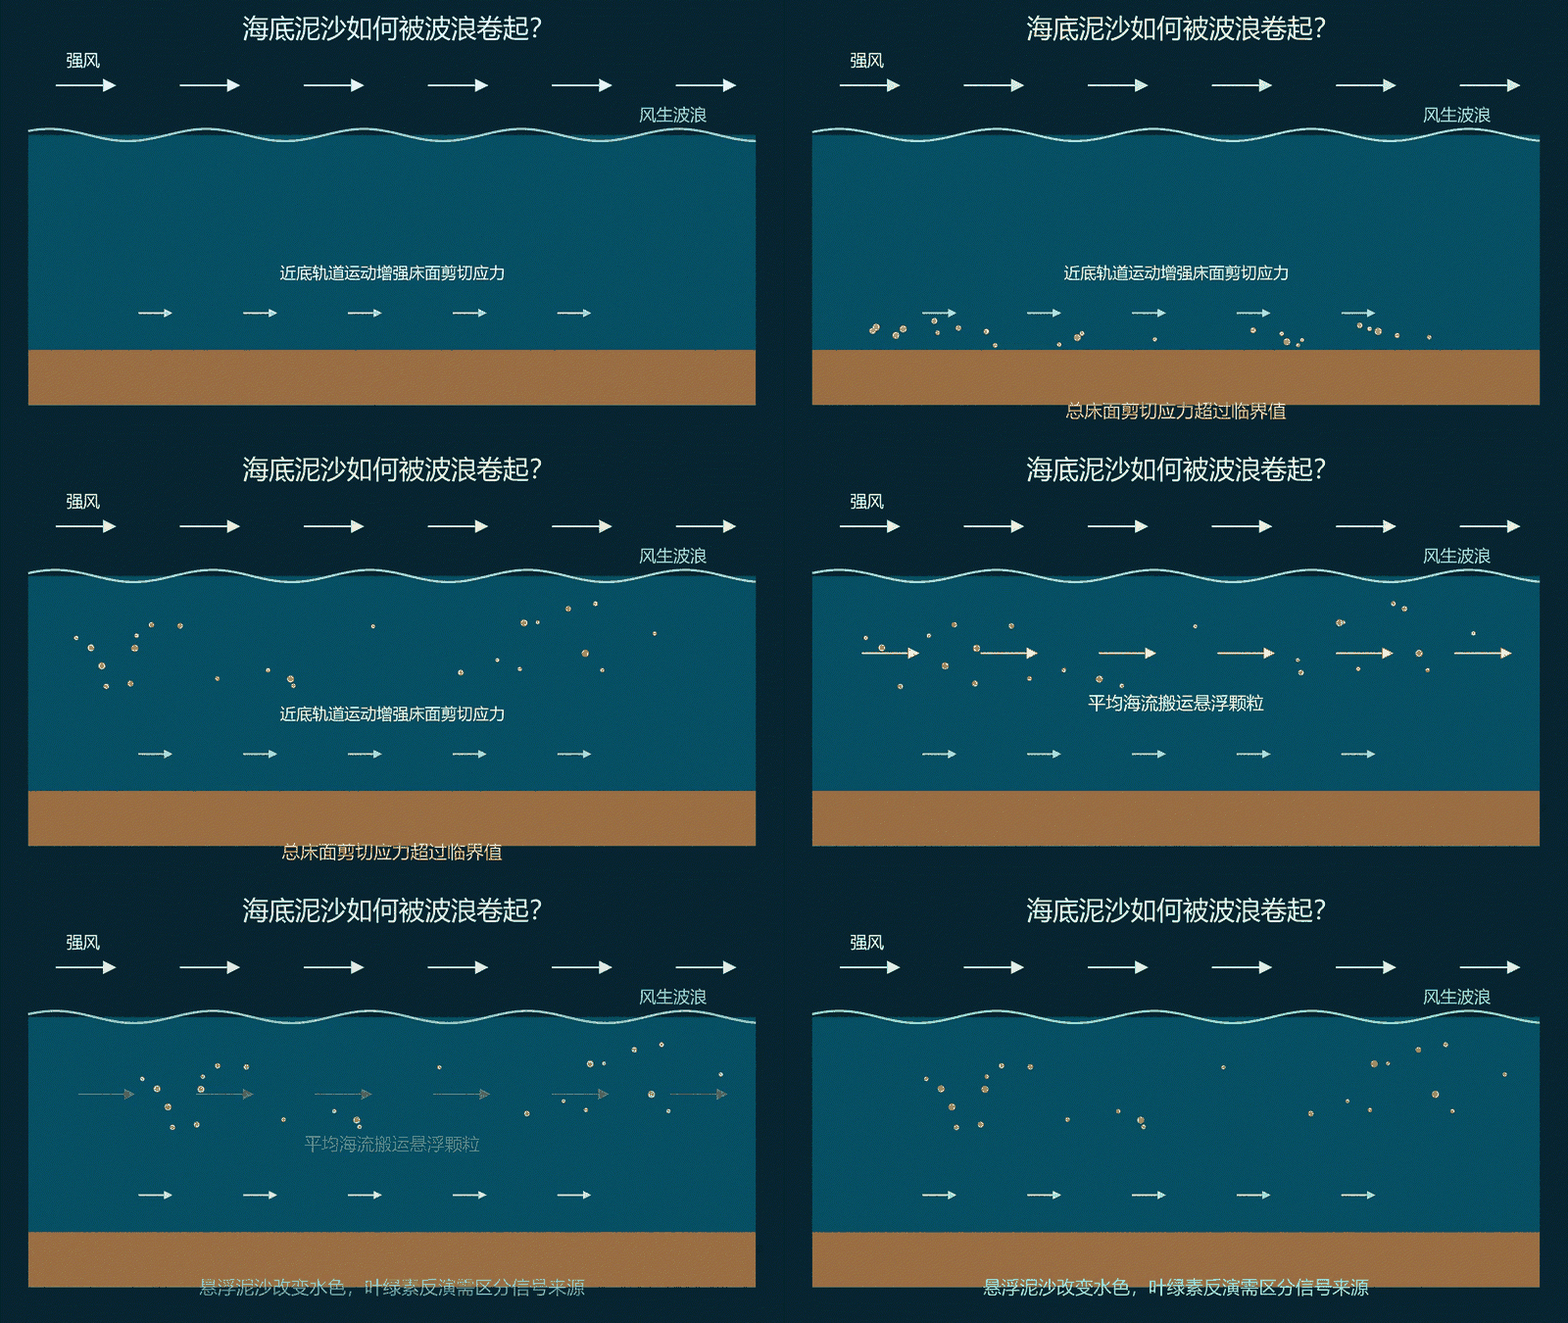
3. 风暴:能量怎样到达海底?3. Storms: how does energy reach the seabed?
强风输入能量,形成波浪;波浪进入浅水区时,近底往复运动可以增强床面剪切应力。波流共同产生的床面应力超过颗粒起动阈值,泥沙才可能被卷起。不能只凭风大就认定所有海底都会再悬浮。Wind supplies energy to waves. As waves enter shallow water, near-bed orbital motion can increase bed shear stress. Resuspension becomes possible when combined wave–current stress exceeds the erosion threshold; strong wind alone does not establish resuspension everywhere.
4. 河流:表层羽流携带了什么?4. Rivers: what does a surface plume carry?
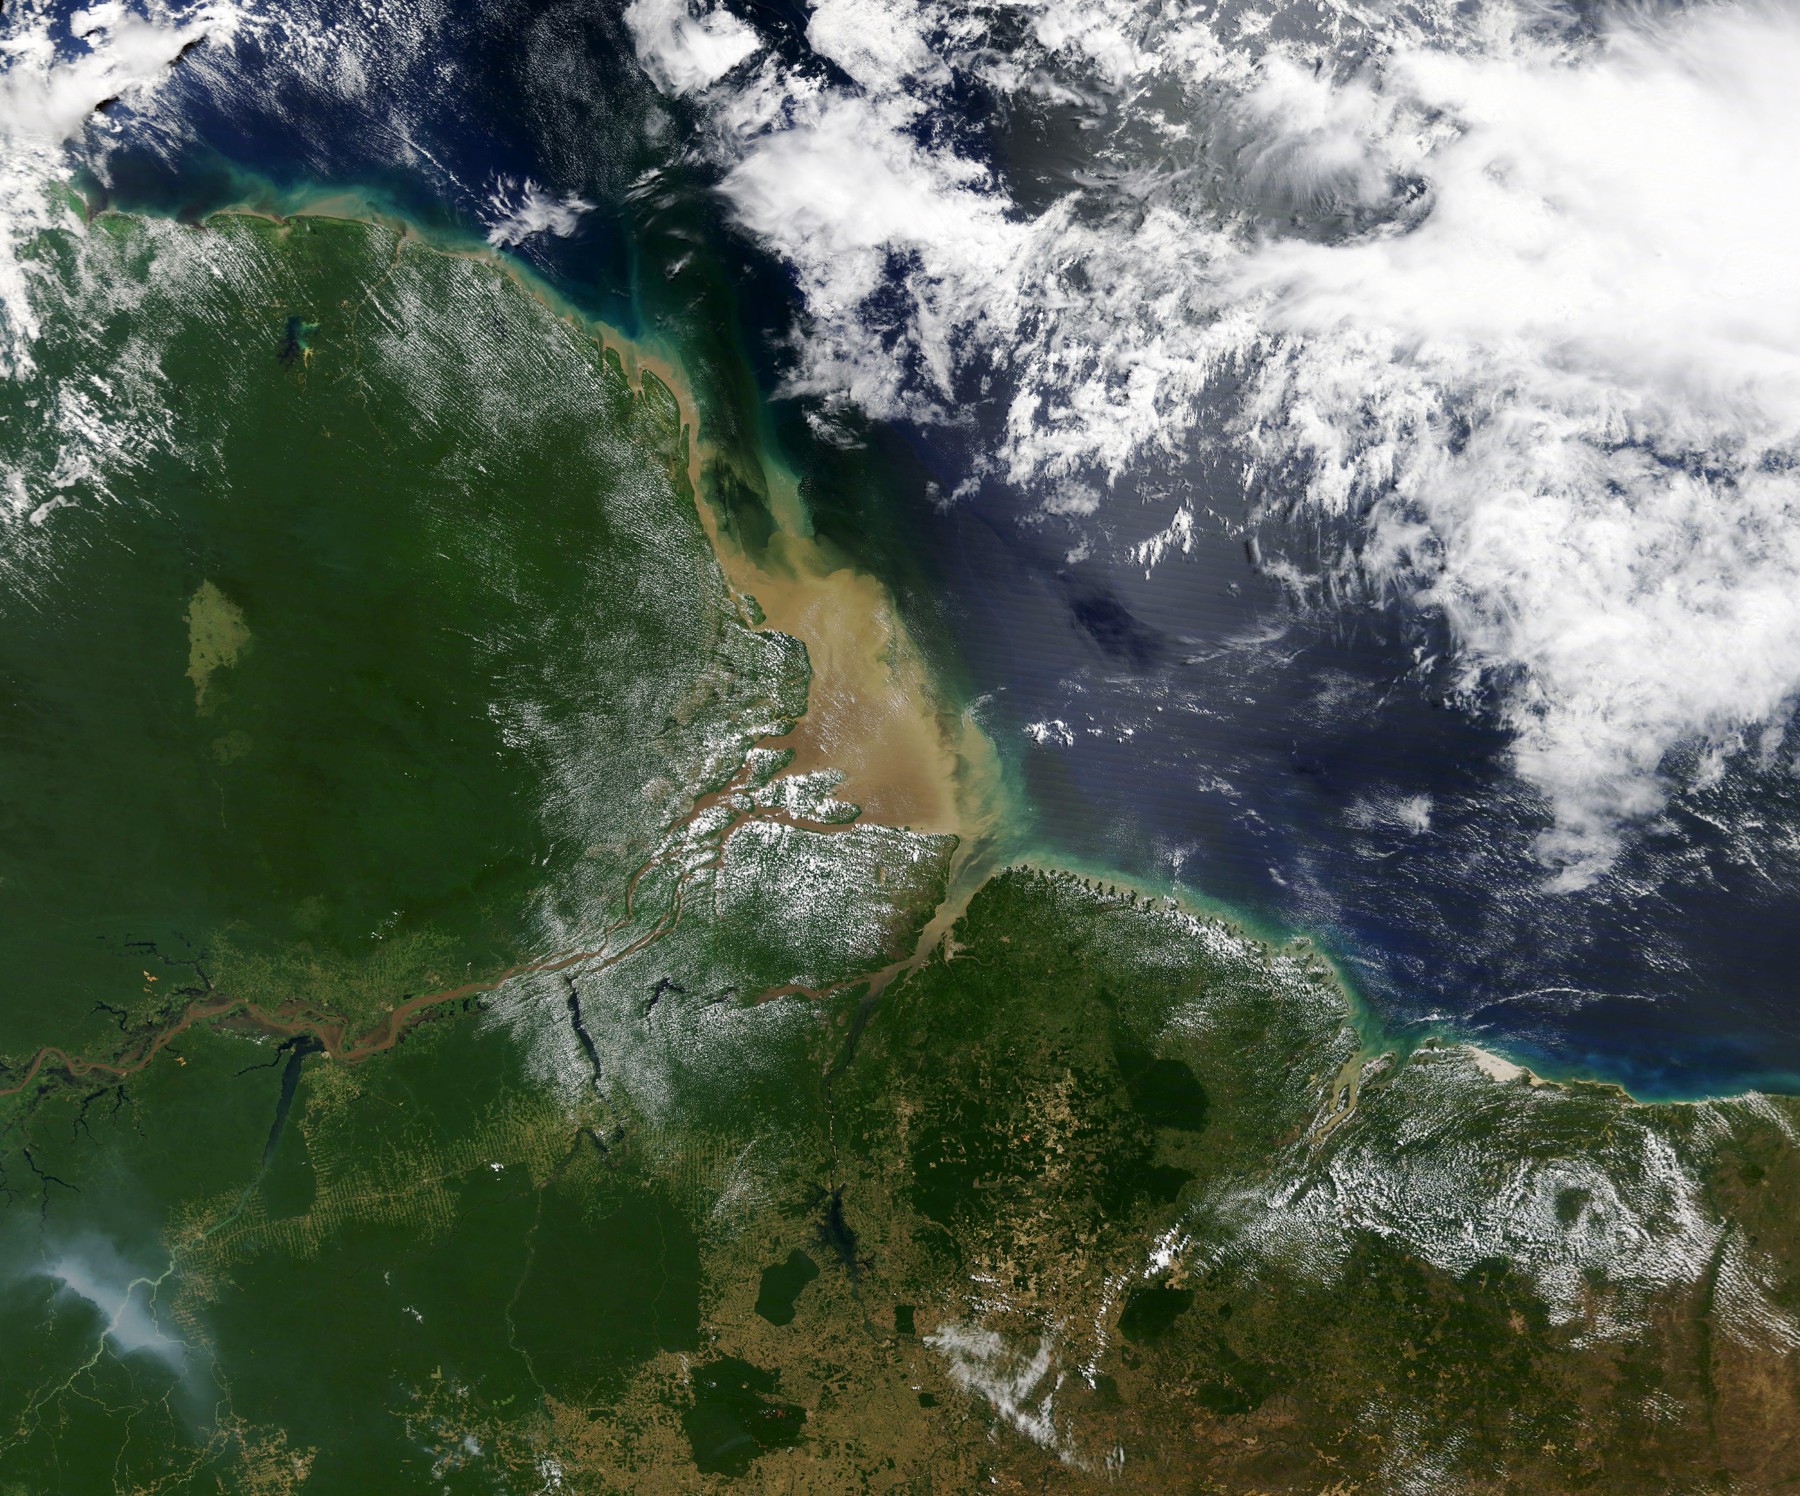
河水通常更淡、更轻,入海后常沿表层扩展,携带悬浮泥沙、营养盐和有色溶解有机物。风、潮流与沿岸流共同影响羽流的延伸方向。下图为亚马孙河案例,用来帮助理解羽流,不是海南观测。River water is usually fresher and lighter and often spreads near the surface, carrying suspended sediment, nutrients and colored dissolved organic matter. Winds, tides and coastal currents shape the plume. The Amazon image below is an illustration, not a Hainan observation.
PPT标注来源:NASA Earth Observatory,Mud from the Andes Carried by the Amazon(2020)。Credit as supplied: NASA Earth Observatory, Mud from the Andes Carried by the Amazon (2020).
5. 再悬浮:沉下去的泥沙重新出现5. Resuspension: sediment returns to the water column
过程可以分为起动、悬浮、输运:床面应力使颗粒起动,湍流帮助颗粒保持悬浮,平均海流将其搬运。浅水区对波浪近底作用常更敏感。下面保留PPT中的Manim教学动画。The stages are erosion, suspension and transport: bed stress mobilizes grains, turbulence helps maintain suspension and mean currents advect them. Shallow areas are often more sensitive to wave-driven bottom motion. The Manim teaching animation is retained from the deck.
动画:原PPT注明由Manim制作;是否使用AI生成原脚本未核实。Animation credited to Manim in the deck; AI involvement in the original script is unverified.
6. 同一种颜色,可能有不同来源6. Similar colors can have different sources
浮游植物的叶绿素影响光的吸收;悬浮颗粒增强散射;有色溶解有机物(CDOM)吸收蓝光。叶绿素a、总悬浮物TSM/SPM与CDOM可能共同作用,因此近岸叶绿素反演需要区分各类光学贡献。Chlorophyll affects light absorption, suspended particles enhance scattering, and CDOM absorbs blue light. Chlorophyll a, TSM/SPM and CDOM may contribute together, so coastal chlorophyll retrieval must distinguish their optical effects.
7. 解谜:先理解水体,再反演叶绿素7. Resolution: understand the water before retrieving chlorophyll
依次考虑大气校正、水体分类、分类反演和物理验证。先尽量取得水体反射信号,再区分清水、浑浊水及河口羽流,选择适合的模型,最后结合风、降雨、径流、潮汐和海流检查解释。水色是结果,海水运动是线索;这个故事提供机制框架,不是对某次异常的定量归因。Consider atmospheric correction, water-type classification, suitable retrieval models and physical validation. Check the interpretation against winds, rainfall, runoff, tides and currents. Color is an outcome and circulation provides clues; this story is a mechanism framework, not quantitative attribution of a particular event.
下载版仅压缩静态图片,幻灯片结构、文本和内嵌GIF动画保持不变。 / Static images compressed; slide structure, text and embedded GIF preserved.
出门票Exit Tickets
12份课堂提交记录,按主题整理。点击图片可查看完整原图。Twelve classroom submissions organized by topic. Select an image to view the full original.
原始截图由邹乔木提供,保留提交内容与评分状态;标题、英文翻译与网页编排由OpenAI Codex辅助整理。截图中的旧网址作为历史记录保留。Original screenshots supplied by Zou Qiaomu, with submitted content and grading status preserved. OpenAI Codex assisted with titles, English translations and layout. Old URLs in screenshots remain as historical records.
AI辅助整理:OpenAI Codex|本节的解释、中文改写、英文翻译或网页编排含AI生成内容;引用资料及用户原始材料不因此变为AI生成。AI assistance: OpenAI Codex. Explanations, rewriting, English translation or layout include AI-generated work; cited and supplied source materials retain their own provenance.